---
title: Add SurveyJS Dashboard to Your JavaScript Application | Step-by-Step Tutorial
description: Learn how to add SurveyJS Dashboard to your JavaScript application with this comprehensive step-by-step tutorial. Enhance your self-hosted surveying tool with powerful survey analytics capabilities.
---
# Add SurveyJS Dashboard to a JavaScript Application
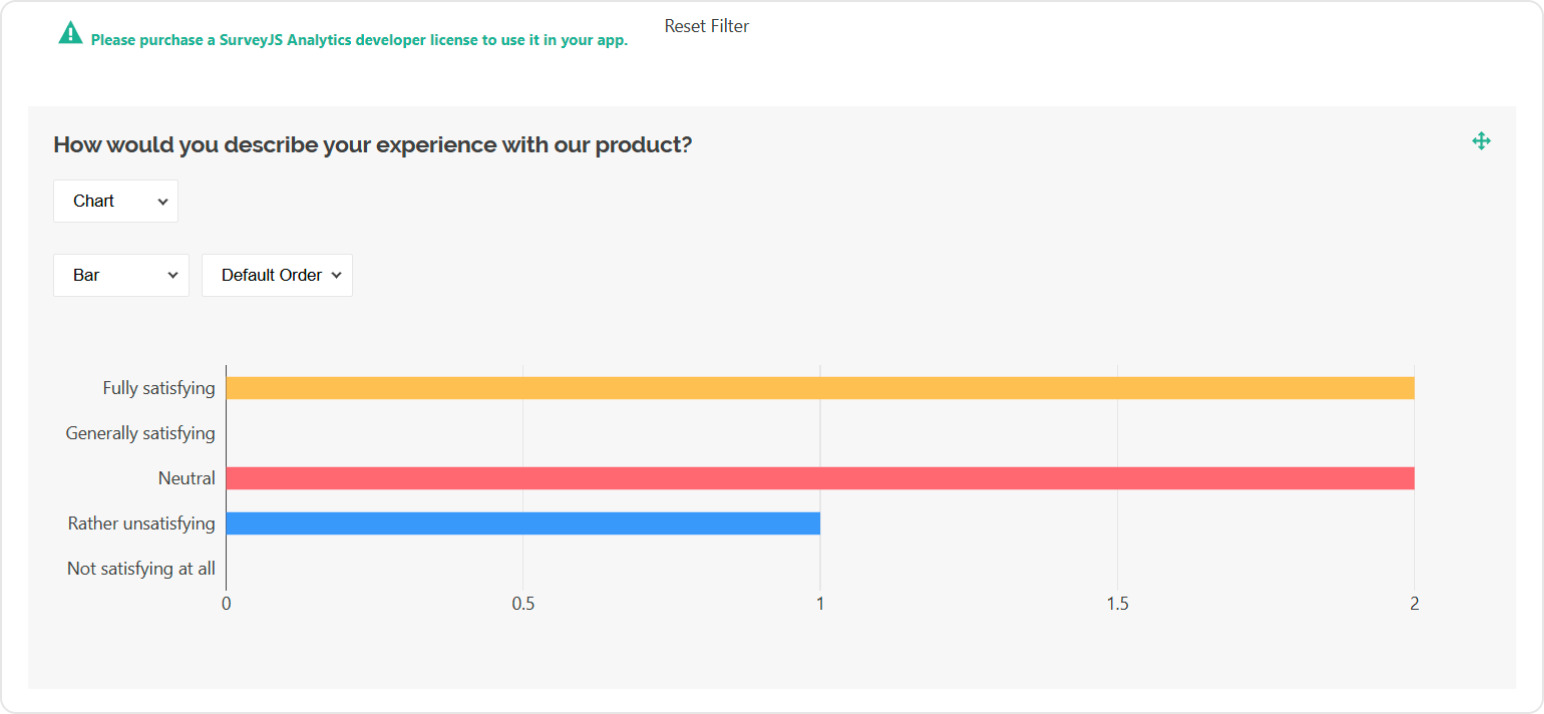
This step-by-step tutorial will help you get started with SurveyJS Dashboard in an application built with HTML, CSS, and JavaScript (without frontend frameworks). As a result, you will create a dashboard displayed below:
View Live Example
[View Full Code on GitHub](https://github.com/surveyjs/code-examples/tree/main/get-started-analytics/html-css-js (linkStyle))
## Link Resources
SurveyJS Dashboard depends on other JavaScript libraries. Reference them on your page in the following order:
1. Survey Core
A platform-independent part of [SurveyJS Form Library](https://surveyjs.io/form-library/documentation/overview) that works with the survey model. SurveyJS Dashboard requires only this part, but if you also display the survey on the page, reference [the rest of the SurveyJS Form Library resources](/form-library/documentation/get-started-html-css-javascript#link-surveyjs-resources) as well.
1. Plotly.js
A third-party library used to render charts.
1. SurveyJS Dashboard
A library that integrates Survey Core with Plotly.js.
The following code shows how to reference these libraries:
```html
```
## Load Survey Results
When a respondent completes a survey, a JSON object with their answers is passed to the `SurveyModel`'s [`onComplete`](https://surveyjs.io/form-library/documentation/api-reference/survey-data-model#onComplete) event handler. Send this object to your server and store it with a specific survey ID (see [Handle Survey Completion](/form-library/documentation/get-started-html-css-javascript#handle-survey-completion)). A collection of these JSON objects forms the data source for the Dashboard. You can aggregate this data either on the server or on the client.
### Server-Side Data Processing
By default, the Dashboard loads all stored responses and processes them in the browser, which can degrade performance as the dataset grows. To optimize load times, move aggregation logic to the server and return only precomputed statistics to the client. See the following demo for a reference implementation:
[SurveyJS Dashboard: Server-Side Data Processing Demo Example](https://github.com/surveyjs/surveyjs-dashboard-nodejs-mongodb (linkStyle))
### Client-Side Data Processing
With client-side processing, the Dashboard loads the full dataset at startup and performs aggregation in the browser. This approach requires more bandwidth and client-side resources, but is sufficient and often simpler for smaller datasets.
To load the survey results, send the survey ID to your server and return an array of JSON objects:
```js
const SURVEY_ID = 1;
loadSurveyResults("https://your-web-service.com/" + SURVEY_ID)
.then((surveyResults) => {
// ...
// Configure and render the Visualization Panel here
// Refer to the help topics below
// ...
});
function loadSurveyResults (url) {
return new Promise((resolve, reject) => {
const request = new XMLHttpRequest();
request.open('GET', url);
request.setRequestHeader('Content-Type', 'application/x-www-form-urlencoded');
request.onload = () => {
const response = request.response ? JSON.parse(request.response) : [];
resolve(response);
}
request.onerror = () => {
reject(request.statusText);
}
request.send();
});
}
```
For demonstration purposes, this tutorial uses predefined survey results. The following code shows a survey model and the structure of the survey results array:
```js
const surveyJson = {
elements: [{
name: "satisfaction-score",
title: "How would you describe your experience with our product?",
type: "radiogroup",
choices: [
{ value: 5, text: "Fully satisfying" },
{ value: 4, text: "Generally satisfying" },
{ value: 3, text: "Neutral" },
{ value: 2, text: "Rather unsatisfying" },
{ value: 1, text: "Not satisfying at all" }
],
isRequired: true
}, {
name: "nps-score",
title: "On a scale of zero to ten, how likely are you to recommend our product to a friend or colleague?",
type: "rating",
rateMin: 0,
rateMax: 10,
}],
completedHtml: "Thank you for your feedback!",
};
const surveyResults = [{
"satisfaction-score": 5,
"nps-score": 10
}, {
"satisfaction-score": 5,
"nps-score": 9
}, {
"satisfaction-score": 3,
"nps-score": 6
}, {
"satisfaction-score": 3,
"nps-score": 6
}, {
"satisfaction-score": 2,
"nps-score": 3
}];
```
## Configure the Visualization Panel
Analytics charts are displayed in a Visualization Panel. Specify [its properties](/Documentation/Analytics?id=ivisualizationpaneloptions) in a configuration object. In this tutorial, the object enables the [`allowHideQuestions`](/Documentation/Analytics?id=ivisualizationpaneloptions#allowHideQuestions) property:
```js
const vizPanelOptions = {
allowHideQuestions: false
}
```
Pass the configuration object, survey questions, and results to the `VisualizationPanel` constructor as shown in the code below to instantiate the Visualization Panel. Assign the produced instance to a constant that will be used later to render the component:
```js
const surveyJson = { /* ... */ };
const surveyResults = [ /* ... */ ];
const vizPanelOptions = { /* ... */ };
const survey = new Survey.Model(surveyJson);
const vizPanel = new SurveyAnalytics.VisualizationPanel(
survey.getAllQuestions(),
surveyResults,
vizPanelOptions
);
```
View Full Code
```html
SurveyJS Dashboard
```
```js
const surveyJson = {
elements: [{
name: "satisfaction-score",
title: "How would you describe your experience with our product?",
type: "radiogroup",
choices: [
{ value: 5, text: "Fully satisfying" },
{ value: 4, text: "Generally satisfying" },
{ value: 3, text: "Neutral" },
{ value: 2, text: "Rather unsatisfying" },
{ value: 1, text: "Not satisfying at all" }
],
isRequired: true
}, {
name: "nps-score",
title: "On a scale of zero to ten, how likely are you to recommend our product to a friend or colleague?",
type: "rating",
rateMin: 0,
rateMax: 10,
}],
completedHtml: "Thank you for your feedback!",
};
const survey = new Survey.Model(surveyJson);
const surveyResults = [{
"satisfaction-score": 5,
"nps-score": 10
}, {
"satisfaction-score": 5,
"nps-score": 9
}, {
"satisfaction-score": 3,
"nps-score": 6
}, {
"satisfaction-score": 3,
"nps-score": 6
}, {
"satisfaction-score": 2,
"nps-score": 3
}];
const vizPanelOptions = {
allowHideQuestions: false
}
const vizPanel = new SurveyAnalytics.VisualizationPanel(
survey.getAllQuestions(),
surveyResults,
vizPanelOptions
);
```
## Render the Visualization Panel
A Visualization Panel should be rendered in a page element. Add this element to the page markup:
```html
```
To render the Visualization Panel in the page element, call the `render(container)` method on the Visualization Panel instance you created in the previous step:
```js
document.addEventListener("DOMContentLoaded", function() {
vizPanel.render(document.getElementById("surveyVizPanel"));
});
```
View Full Code
```html
SurveyJS Dashboard
```
```js
const surveyJson = {
elements: [{
name: "satisfaction-score",
title: "How would you describe your experience with our product?",
type: "radiogroup",
choices: [
{ value: 5, text: "Fully satisfying" },
{ value: 4, text: "Generally satisfying" },
{ value: 3, text: "Neutral" },
{ value: 2, text: "Rather unsatisfying" },
{ value: 1, text: "Not satisfying at all" }
],
isRequired: true
}, {
name: "nps-score",
title: "On a scale of zero to ten, how likely are you to recommend our product to a friend or colleague?",
type: "rating",
rateMin: 0,
rateMax: 10,
}],
completedHtml: "Thank you for your feedback!",
};
const survey = new Survey.Model(surveyJson);
const surveyResults = [{
"satisfaction-score": 5,
"nps-score": 10
}, {
"satisfaction-score": 5,
"nps-score": 9
}, {
"satisfaction-score": 3,
"nps-score": 6
}, {
"satisfaction-score": 3,
"nps-score": 6
}, {
"satisfaction-score": 2,
"nps-score": 3
}];
const vizPanelOptions = {
allowHideQuestions: false
}
const vizPanel = new SurveyAnalytics.VisualizationPanel(
survey.getAllQuestions(),
surveyResults,
vizPanelOptions
);
document.addEventListener("DOMContentLoaded", function() {
vizPanel.render(document.getElementById("surveyVizPanel"));
});
```
[View Full Code on GitHub](https://github.com/surveyjs/code-examples/tree/main/get-started-analytics/html-css-js (linkStyle))
## Activate a SurveyJS License
SurveyJS Dashboard is not available for free commercial use. To integrate it into your application, you must purchase a [commercial license](https://surveyjs.io/licensing) for the software developer(s) who will be working with the Dashboard APIs and implementing the integration. If you use SurveyJS Dashboard without a license, an alert banner will appear at the top of the interface:
After purchasing a license, follow the steps below to activate it and remove the alert banner:
1. [Log in](https://surveyjs.io/login) to the SurveyJS website using your email address and password. If you've forgotten your password, [request a reset](https://surveyjs.io/reset-password) and check your inbox for the reset link.
2. Open the following page: [How to Remove the Alert Banner](https://surveyjs.io/remove-alert-banner). You can also access it by clicking **Set up your license key** in the alert banner itself.
3. Follow the instructions on that page.
Once you've completed the setup correctly, the alert banner will no longer appear.
## See Also
[Dashboard Demo Examples](/dashboard/examples/ (linkStyle))
 After purchasing a license, follow the steps below to activate it and remove the alert banner:
1. [Log in](https://surveyjs.io/login) to the SurveyJS website using your email address and password. If you've forgotten your password, [request a reset](https://surveyjs.io/reset-password) and check your inbox for the reset link.
2. Open the following page: [How to Remove the Alert Banner](https://surveyjs.io/remove-alert-banner). You can also access it by clicking **Set up your license key** in the alert banner itself.
3. Follow the instructions on that page.
Once you've completed the setup correctly, the alert banner will no longer appear.
## See Also
[Dashboard Demo Examples](/dashboard/examples/ (linkStyle))
After purchasing a license, follow the steps below to activate it and remove the alert banner:
1. [Log in](https://surveyjs.io/login) to the SurveyJS website using your email address and password. If you've forgotten your password, [request a reset](https://surveyjs.io/reset-password) and check your inbox for the reset link.
2. Open the following page: [How to Remove the Alert Banner](https://surveyjs.io/remove-alert-banner). You can also access it by clicking **Set up your license key** in the alert banner itself.
3. Follow the instructions on that page.
Once you've completed the setup correctly, the alert banner will no longer appear.
## See Also
[Dashboard Demo Examples](/dashboard/examples/ (linkStyle))