Turn your survey results into powerful dashboards and get insights in no time.
An open-source JavaScript library for survey data visualization and analysis.
Surveying makes decision-making data-informed.
Surveys provide you with valuable data essential for decision-making and business growth.

Ask your customers what they think about your products, services and overall customer experience to find areas for improvement.
Get better understanding of your customer needs and ensure their long-term loyalty identify.
Measure public option to understand the attitudes, beliefs, and opinions of the population on various issues, and to predict its behavior.

Detect trends and patterns in customer behavior to develop more effective marketing and product development strategies.
Before getting into a new market, you can do a market research to gather valuable data on its customer buying behavior, existing competitors, customer demographics, preferences, etc. and plan your market penetration strategy better.
Ensure a positive work environment and reduce turnover in your organization with regular employee surveying that provides direct and timely feedback and helps estimate employee satisfaction level.
Get Started with SurveyJS Today and Enjoy an Industry-Leading Survey Experience


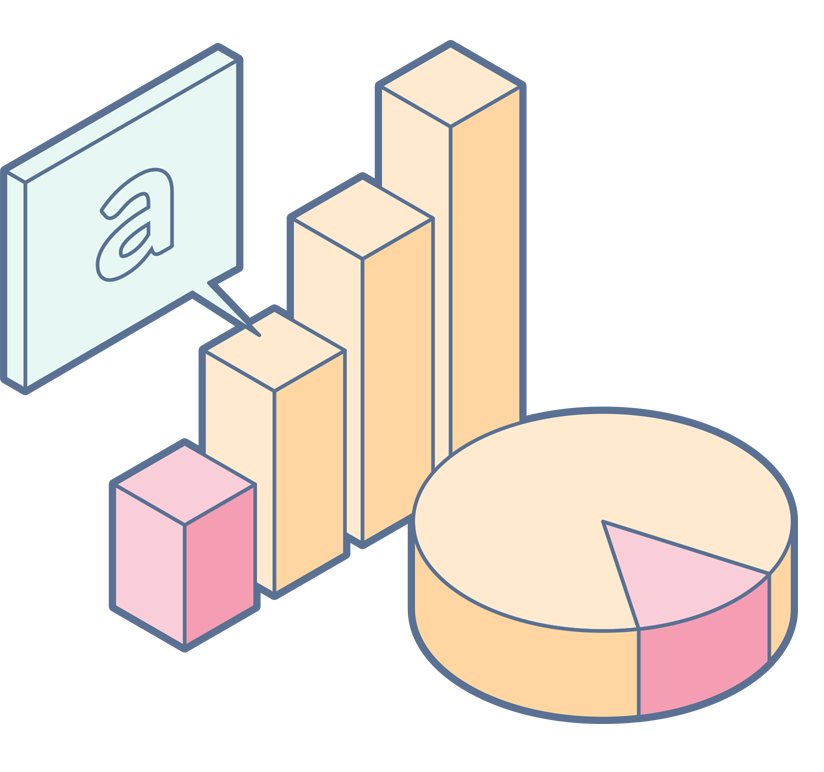
Analysis of large amounts of survey data is simple if you visualize it.
The SurveyJS Dashboard library allows its users to gather all survey data in one place and render it as interactive charts and tables.
Clear
SurveyJS dashboards make it easy to see patterns and trends in survey data with its graphical representations.

User-Friendly
SurveyJS dashboards have an intuitive interface which makes it easy for anyone analyze survey data.
Customizable
You can customize the default layout and settings of your dashboard and save them in the localStorage to make survey data analysis faster, more focused, ensure personalized experience.
Display only the data that is relevant to your requirements: simply drag charts to re-position, add visualization panels to enable chart grouping, hide unwanted charts, apply filters, and more.
Interactive
SurveyJS dashboards are interactive and allow you use various available chart types for your data to see which one works best for a certain question. You can choose between a Plotly Gauge Chart, Bar Chart, Pie Chart, Word Bubble chart, and others. All charts are customizable, for example you can set to display only extreme values in all or some of your bart charts in a dashboard, or switch data display mode for vertical to horizontal for easy comparison and analysis of of user responses.
Multilingual
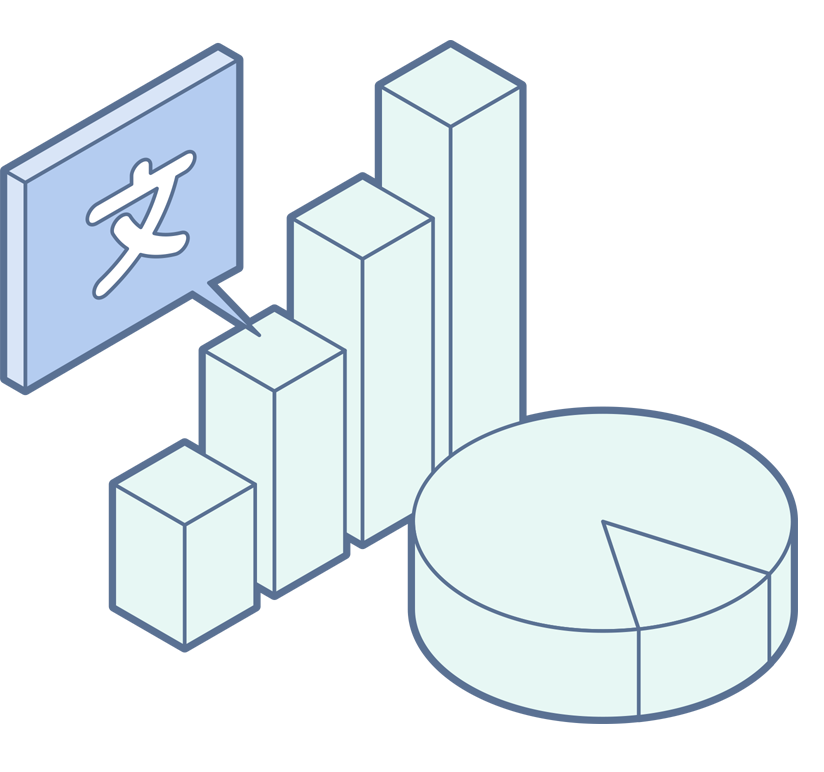
If you create a multilingual survey, your SurveyJS dashboard will group all survey data, including results and contents by language that you can switch by using a language filter. This way survey data can be analyzed by specialists having different mother tongues.
Why choose SurveyJS Dashboard to build custom dashboards?
The SurveyJS Dashboard library is a part of the SurveyJS product family. It completes the survey management lifecycle by allowing its users analyze the received survey data in a convenient and secure way.
Over 100 free demos for React, Angular, Vue, jQuery, and Knockout to get you started.
Users can save and download survey results as tables in Excel, CSV and PDF formats.
You can style the look of your dashboards by modifying the colors, fonts, etc.
Supports all popular chart types and their customization.
Allows secure storage of processed survey data.
Offers real-time data updates.
Still got questions?
Check our FAQ or Contact Us