Table View for Survey Results in a React Application
This step-by-step tutorial will help you set up a table view for survey results using SurveyJS Dashboard in a React application. To add the table view to your application, follow the steps below:
- Install the
survey-analyticsnpm Package - Configure Styles
- Load Survey Results
- Render the Table
- Enable Export to PDF and Excel
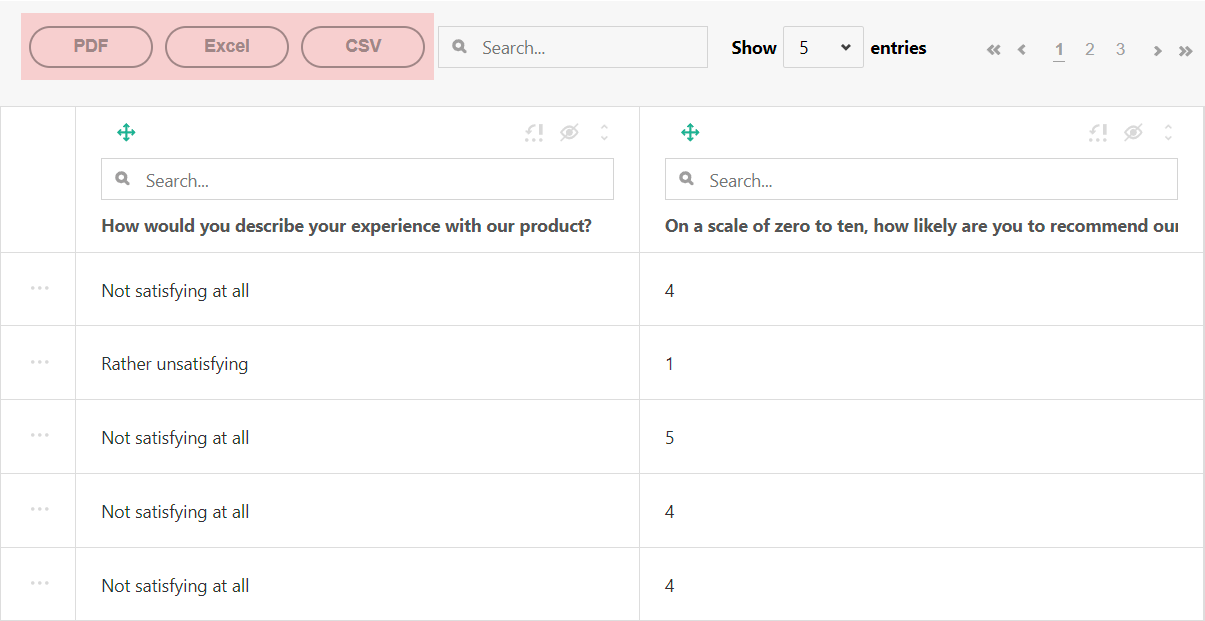
As a result, you will create the following view:
If you are looking for a quick-start application that includes all SurveyJS components, refer to the following GitHub repositories:
- SurveyJS + React Quickstart Template
- SurveyJS + Next.js Quickstart Template
- SurveyJS + Remix Quickstart Template
Install the survey-analytics npm Package
SurveyJS Dashboard is distributed as a survey-analytics npm package. Run the following command to install it:
npm install survey-analytics --save
The table view for SurveyJS Dashboard depends on the Tabulator library. The command above automatically installs it as a dependency.
Configure Styles
Import the Tabulator and table view style sheets in the component that will render the table view:
import 'tabulator-tables/dist/css/tabulator.min.css';
import 'survey-analytics/survey.analytics.tabulator.min.css';
Load Survey Results
You can access survey results as a JSON object within the SurveyModel's onComplete event handler. Send the results to your server and store them with a specific survey ID. Refer to the Handle Survey Completion help topic for more information.
To load the survey results, send the survey ID to your server and return an array of JSON objects:
// ...
import { useState } from 'react';

const SURVEY_ID = 1;

export default function App() {
  const [surveyDataTable, setSurveyDataTable] = useState(null);

  if (!surveyDataTable) {
    loadSurveyResults("https://your-web-service.com/" + SURVEY_ID)
      .then((surveyResults) => {
        // ...
        // Configure the table view here
        // Refer to the help topics below
        // ...
      });
  }

  return ();
}

function loadSurveyResults (url) {
  return new Promise((resolve, reject) => {
    const request = new XMLHttpRequest();
    request.open('GET', url);
    request.setRequestHeader('Content-Type', 'application/x-www-form-urlencoded');
    request.onload = () => {
      const response = request.response ? JSON.parse(request.response) : [];
      resolve(response);
    }
    request.onerror = () => {
      reject(request.statusText);
    }
    request.send();
  });
}
For demonstration purposes, this tutorial uses auto-generated survey results. The following code shows a survey model and a function that generates the survey results array:
const surveyJson = {
  elements: [{
    name: "satisfaction-score",
    title: "How would you describe your experience with our product?",
    type: "radiogroup",
    choices: [
      { value: 5, text: "Fully satisfying" },
      { value: 4, text: "Generally satisfying" },
      { value: 3, text: "Neutral" },
      { value: 2, text: "Rather unsatisfying" },
      { value: 1, text: "Not satisfying at all" }
    ],
    isRequired: true
  }, {
    name: "nps-score",
    title: "On a scale of zero to ten, how likely are you to recommend our product to a friend or colleague?",
    type: "rating",
    rateMin: 0,
    rateMax: 10,
  }],
  showQuestionNumbers: "off",
  completedHtml: "Thank you for your feedback!",
};

function randomIntFromInterval(min: number, max: number): number {
  return Math.floor(Math.random() * (max - min + 1) + min);
}
function generateData() {
  const data = [];
  for (let index = 0; index < 100; index++) {
    const satisfactionScore = randomIntFromInterval(1, 5);
    const npsScore = satisfactionScore > 3 ? randomIntFromInterval(7, 10) : randomIntFromInterval(1, 6);
    data.push({
      "satisfaction-score": satisfactionScore,
      "nps-score": npsScore
    });
  }
  return data;
}
Render the Table
The table view is rendered by the Tabulator component. Import this component and pass the survey model and results to its constructor to instantiate it. Save the produced instance in a state variable that will be used later to render the component:
// ...
import { useState } from 'react';
import { Model } from 'survey-core';
import { Tabulator } from 'survey-analytics/survey.analytics.tabulator';

const surveyJson = { /* ... */ };
function generateData() { /* ... */ }

export default function App() {
  const [survey, setSurvey] = useState(null);
  const [surveyDataTable, setSurveyDataTable] = useState(null);
  const [surveyResults, setSurveyResults] = useState(null);

  if (!survey) {
    const survey = new Model(surveyJson);
    setSurvey(survey);
  }

  if (!surveyResults) {
    setSurveyResults(generateData());
  }

  if (!surveyDataTable && !!survey) {
    const surveyDataTable = new Tabulator(
      survey,
      surveyResults
    );
    setSurveyDataTable(surveyDataTable);
  }

  return ();
}
The table view should be rendered in a page element. Add this element to the component markup, as shown below.
// Uncomment the following line if you are using Next.js:
// 'use client'

// ...
export default function App() {
  // ...
  return (
    <div id="surveyDataTable" />
  );
}
To render the table view in the page element, call the render(containerId) method on the Tabulator instance you created previously:
import { ..., useEffect } from 'react';

export default function App() {
  // ...

  useEffect(() => {
    surveyDataTable.render("surveyDataTable");
    return () => {
      document.getElementById("surveyDataTable").innerHTML = "";
    }
  }, [surveyDataTable]);

  // ...
}
View Full Code
import './App.css'

import { useState, useEffect } from 'react';
import 'tabulator-tables/dist/css/tabulator.min.css';
import 'survey-analytics/survey.analytics.tabulator.min.css';
import { Model } from 'survey-core';
import { Tabulator } from 'survey-analytics/survey.analytics.tabulator';

const surveyJson = {
  elements: [{
    name: "satisfaction-score",
    title: "How would you describe your experience with our product?",
    type: "radiogroup",
    choices: [
      { value: 5, text: "Fully satisfying" },
      { value: 4, text: "Generally satisfying" },
      { value: 3, text: "Neutral" },
      { value: 2, text: "Rather unsatisfying" },
      { value: 1, text: "Not satisfying at all" }
    ],
    isRequired: true
  }, {
    name: "nps-score",
    title: "On a scale of zero to ten, how likely are you to recommend our product to a friend or colleague?",
    type: "rating",
    rateMin: 0,
    rateMax: 10,
  }],
  showQuestionNumbers: "off",
  completedHtml: "Thank you for your feedback!",
};

function randomIntFromInterval(min, max) {
  return Math.floor(Math.random() * (max - min + 1) + min);
}
function generateData() {
  const data = [];
  for (let index = 0; index < 100; index++) {
    const satisfactionScore = randomIntFromInterval(1, 5);
    const npsScore = satisfactionScore > 3 ? randomIntFromInterval(7, 10) : randomIntFromInterval(1, 6);
    data.push({
      "satisfaction-score": satisfactionScore,
      "nps-score": npsScore
    });
  }
  return data;
}

export default function App() {
  const [survey, setSurvey] = useState(null);
  const [surveyDataTable, setSurveyDataTable] = useState(null);
  const [surveyResults, setSurveyResults] = useState(null);
  if (!survey) {
    const survey = new Model(surveyJson);
    setSurvey(survey);
  }
  if (!surveyResults) {
    setSurveyResults(generateData());
  }

  if (!surveyDataTable && !!survey) {
    const surveyDataTable = new Tabulator(
      survey,
      surveyResults
    );
    setSurveyDataTable(surveyDataTable);
  }

  useEffect(() => {
    surveyDataTable.render("surveyDataTable");
    return () => {
      document.getElementById("surveyDataTable").innerHTML = "";
    }
  }, [surveyDataTable]);

  return (
    <div id="surveyDataTable" />
  );
}
Enable Export to PDF and Excel
The table view for SurveyJS Dashboard allows users to save survey results as CSV, PDF, and XLSX documents. Export to CSV is supported out of the box. For export to PDF and XLSX, you need to reference the jsPDF, jsPDF-AutoTable, and SheetJS libraries. Open the index.html file in your project and add the following links to the <head> element:
<!-- jsPDF for export to PDF -->
<script type="text/javascript" src="https://cdnjs.cloudflare.com/ajax/libs/jspdf/1.5.3/jspdf.min.js"></script>
<script type="text/javascript" src="https://cdnjs.cloudflare.com/ajax/libs/jspdf-autotable/3.0.10/jspdf.plugin.autotable.min.js"></script>

<!-- SheetJS for export to Excel -->
<script type="text/javascript" src="https://oss.sheetjs.com/sheetjs/xlsx.full.min.js"></script>
To view the application, run npm run start in a command line and open http://localhost:3000/ in your browser. If you do everything correctly, you should see the following result: