Heilbronn University and GECKO Institute - AStA
About Heilbronn University and GECKO Institute
Heilbronn University of Applied Sciences is one of the largest institutions in the Heilbronn-Franconia region of the Baden-Württemberg state, Germany, serving over 8,000 students across multiple campuses. Emphasizing practical, industry-focused education, the university offers programs in business, engineering, computer science, and healthcare. Close partnerships with local and global companies provide students with valuable real-world experience that prepares them for the ever-evolving job market.
The GECKO Institute is a leading research center at Heilbronn University, driving innovation in healthcare technology, data analytics, and AI. Through collaboration with industry and academic experts, the institute bridges the gap between research and application, shaping the future of healthcare and technology.
The Application: AStA
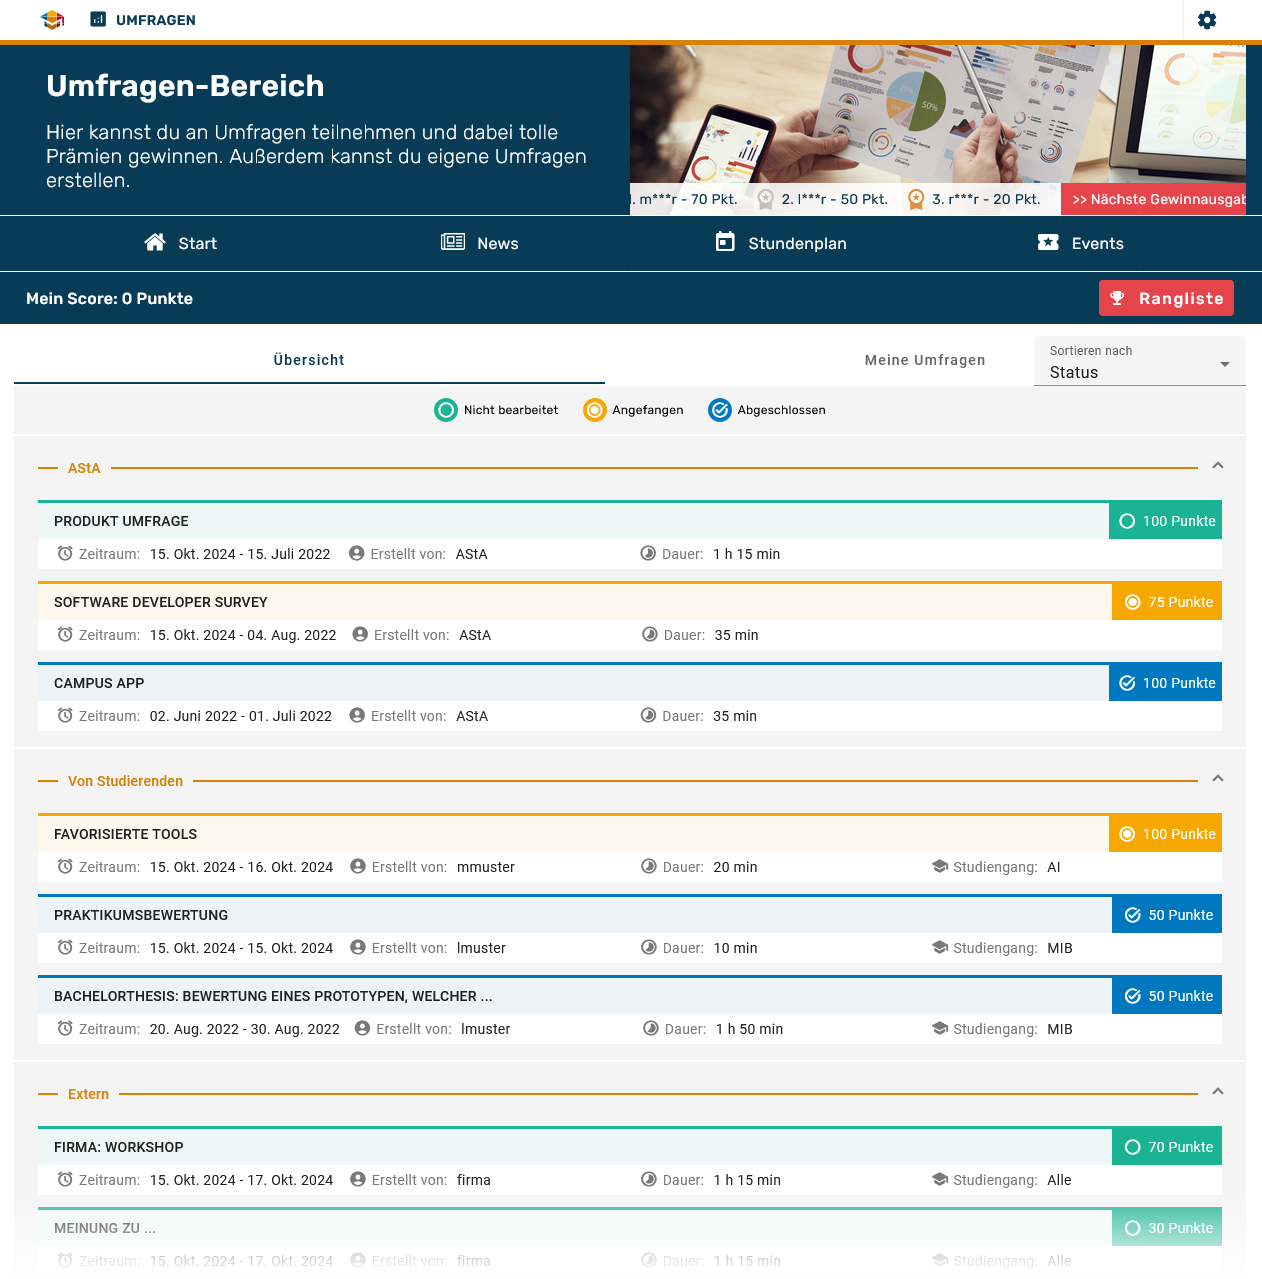
The AStA application of Heilbronn University serves as a convenient resource designed to assist students in remaining informed and connected. The app offers prompt access to important updates, event announcements, and university services. It now also includes an integrated survey tool that enables students to easily create surveys for theses, student projects, and research purposes, as well as to collect responses. This enhancement promotes collaboration and facilitates data collection within the student community. The following images illustrate the implementation of this tool using SurveyJS. The image below shows the main screen with a list of surveys. A color indication helps students understand which surveys they have already completed and which ones remain open at a glimpse.
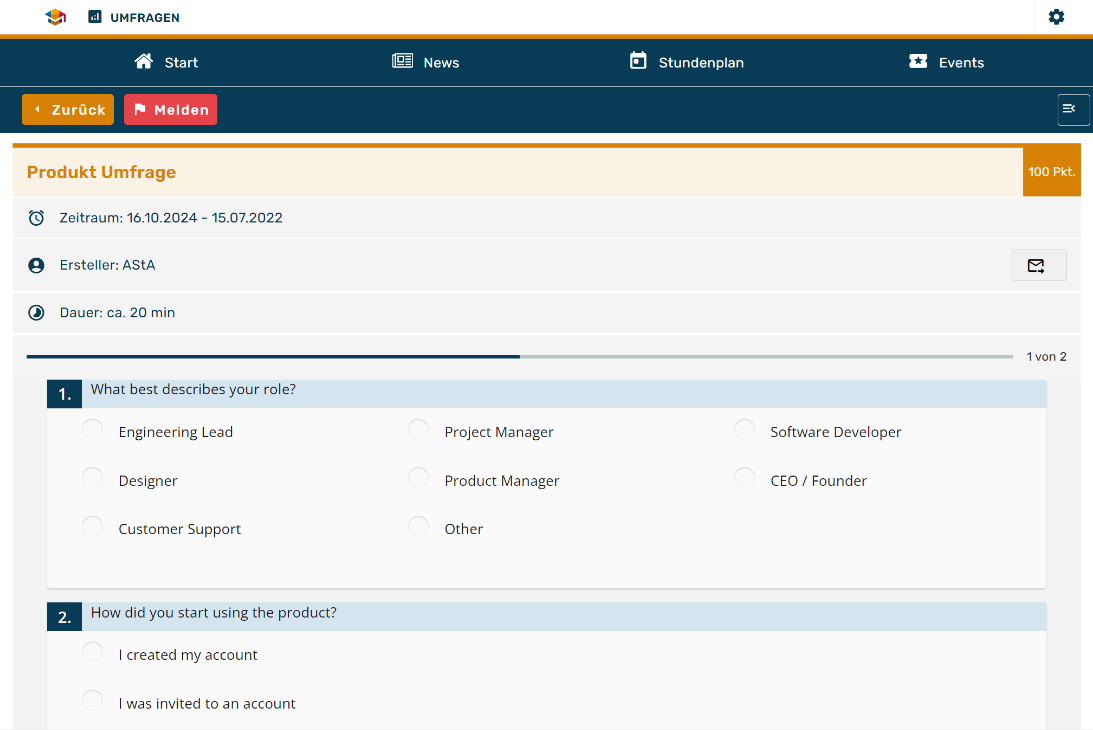
The survey viewer for completing a survey is illustrated below.
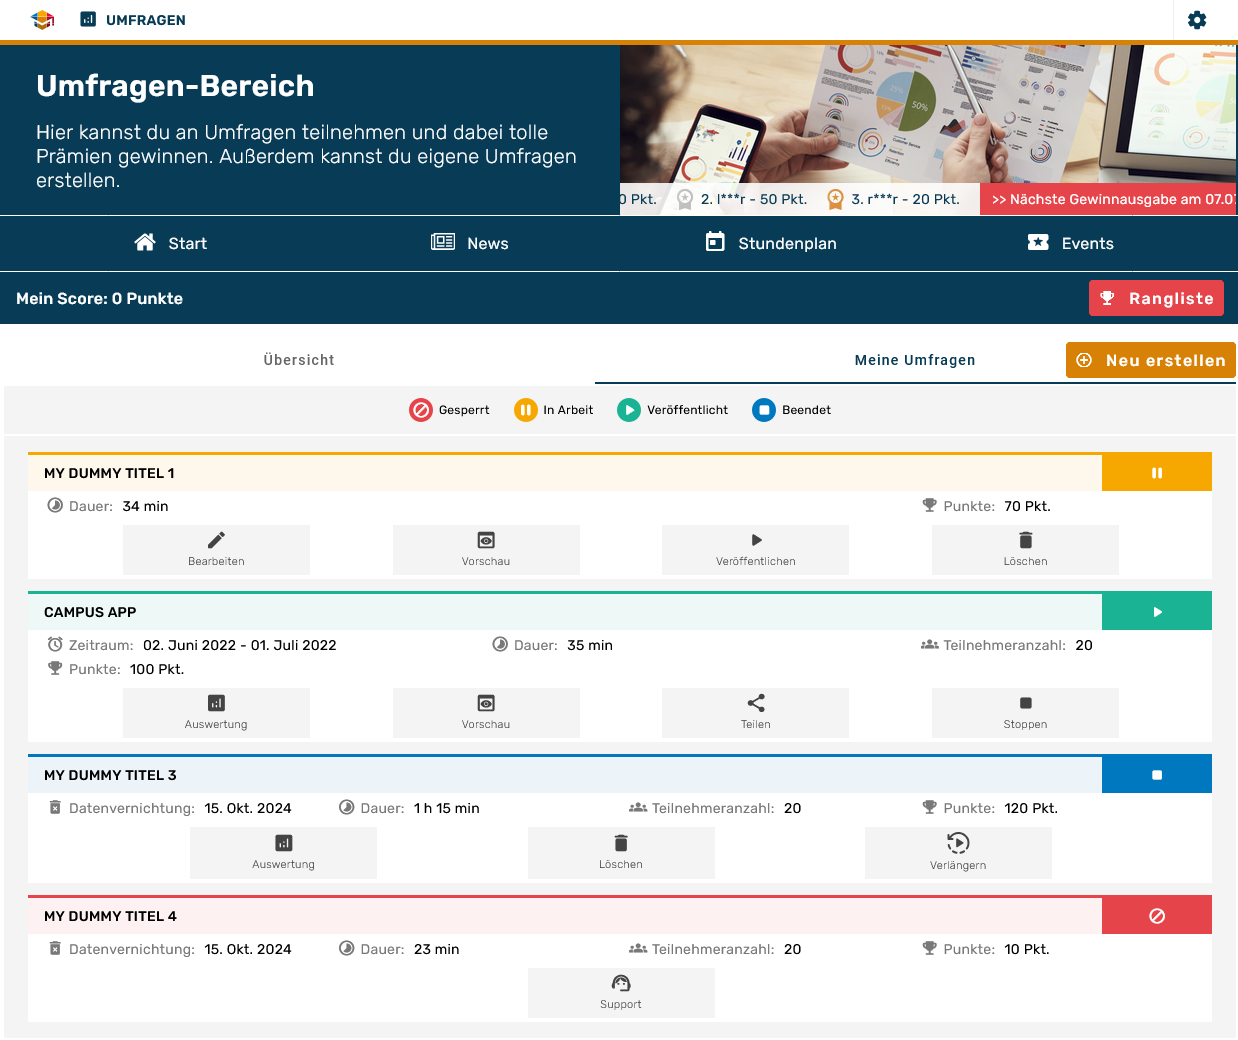
Additionally, students can create their own surveys as needed for projects or theses. With the press of a button, they can navigate to the survey creator and select from various question types as shown in the following images:
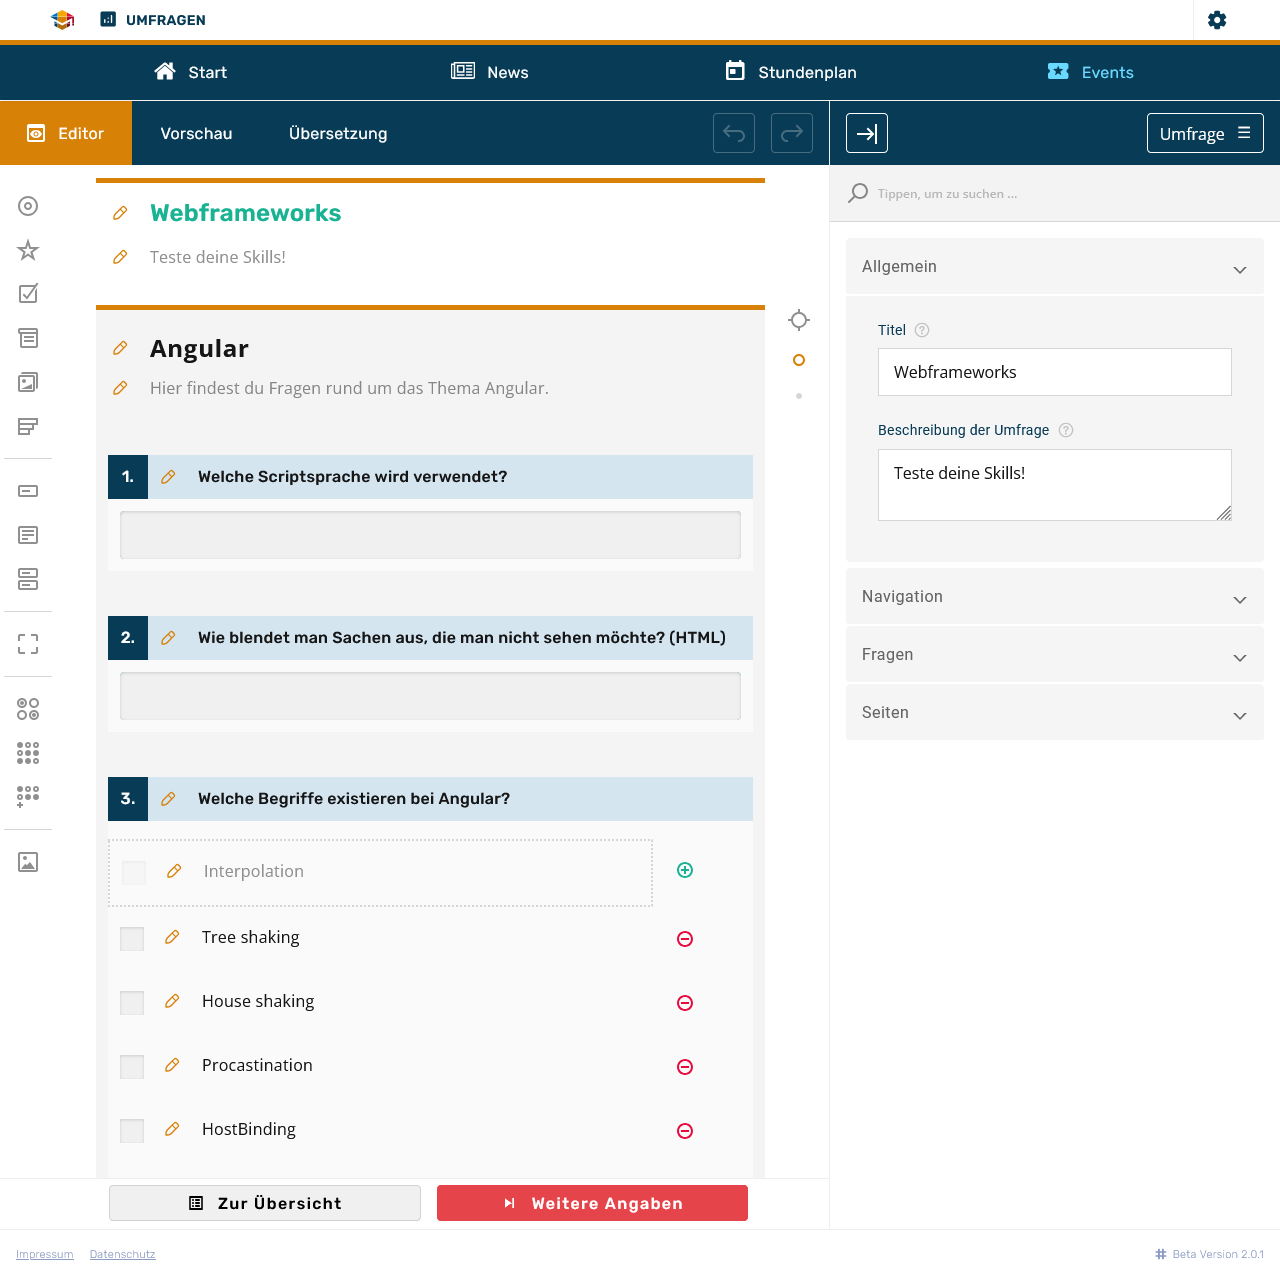
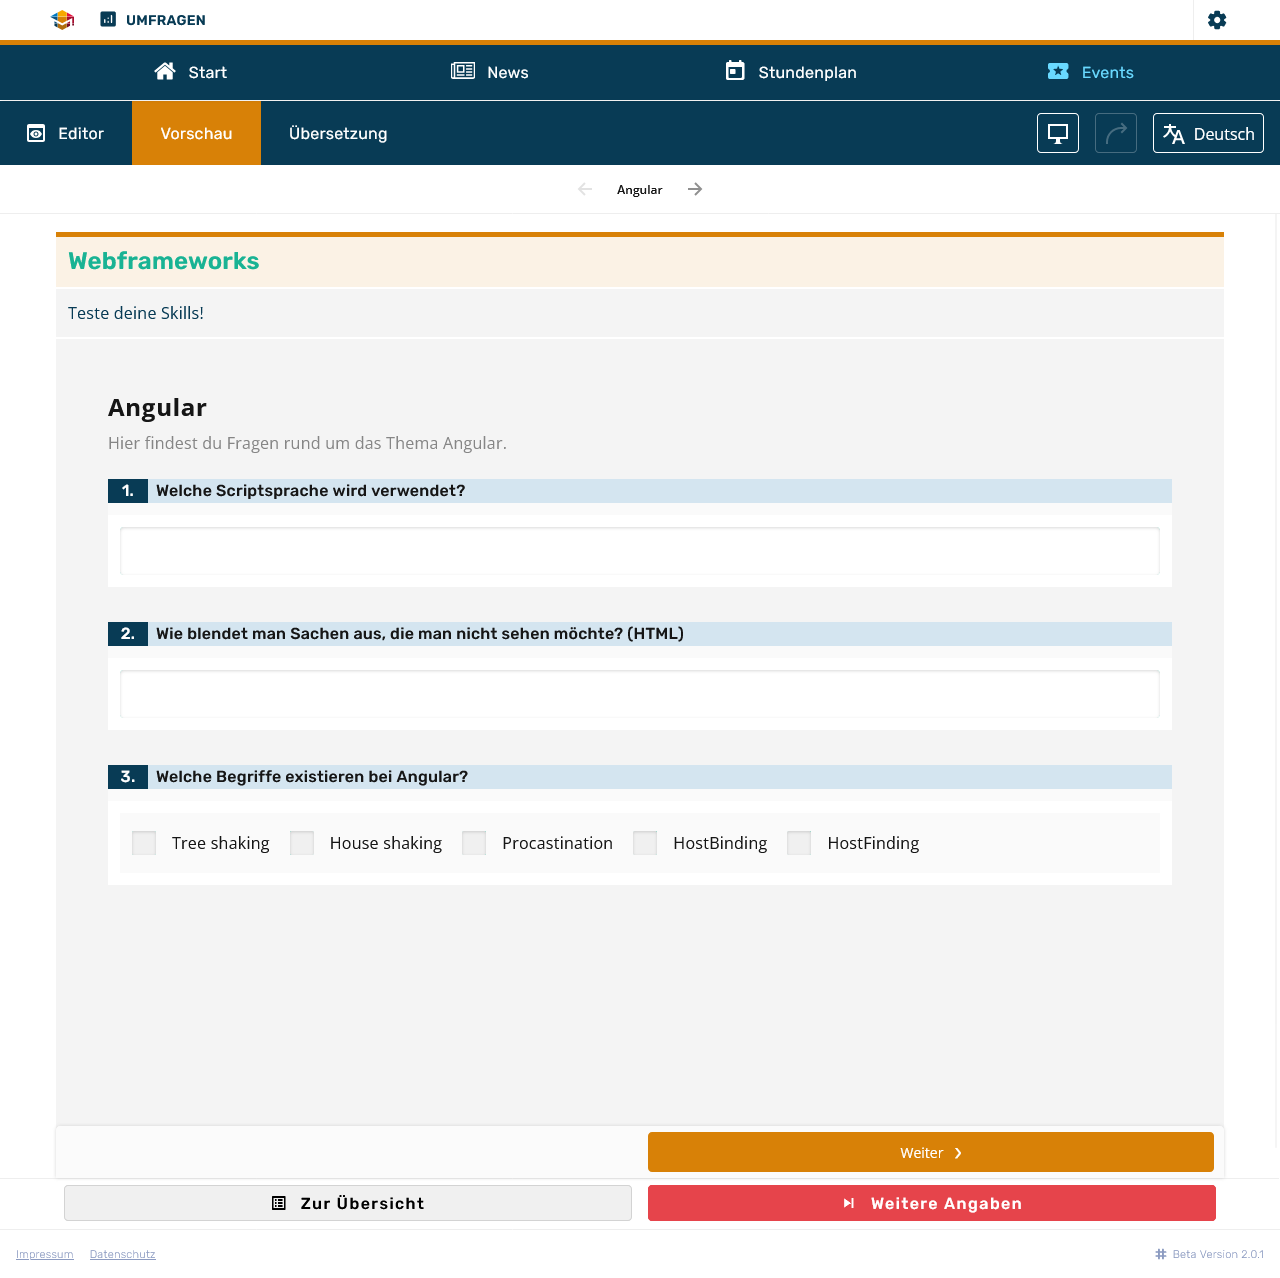
Before publishing their survey, students can navigate to the Preview tab to make sure the survey looks and works well on various devices:
Given the importance of visual presentation and interpretation of survey findings, we have incorporated an analytics function utilizing SurveyJS Dashboard. This feature automatically visualizes the results for each survey question using available types of charts. Consequently, students can easily analyze their data without the need for additional tools. This allows them to concentrate on interpreting findings and drawing conclusions gathered from the survey dashboard insights.

Why did you choose SurveyJS
We chose SurveyJS because it provides a powerful yet easy-to-implement solution for integrating surveys into applications. Its flexible customization options allowed us to match our design and ensure it blends perfectly with the existing UI. SurveyJS offers a wide range of features that are more versatile than many other tools, and its excellent price-performance ratio provides great value for the functionality it delivers. The standout feature is the built-in dashboard, which simplifies the process of visualizing survey results, enabling users to analyze data without needing additional tools. This makes it an all-in-one, cost-effective solution for creating and managing surveys and visualizing survey data.
SurveyJS products used
Experience working with the SurveyJS products and team
Our experience working with SurveyJS products and their team has been exceptional. The products are easy to use and implement, providing a range of features that fit seamlessly into our project. As students, we particularly appreciated the openness and supportiveness of the SurveyJS team. They went above and beyond to assist us with any questions or challenges, ensuring we could successfully integrate their tools into our work. Thanks to their assistance, we were able to implement the survey feature smoothly.


