How to Create a Poll and Visualize Collected Responses in Real Time
In this blog post, we will guide you through all the steps to build a poll with SurveyJS Form Library and then visualize the results that are being submitted in real time with SurveyJS Dashboard. Plus — a sample React demo inside.

The Power of Conducting Polls
Running a poll is an effective way to measure public opinion on a particular issue or topic. By asking a representative sample of the population a set of questions on their views, pollsters can gather an accurate and actionable snapshot of what people think. Polls can also help identify trends in public opinion over time. By conducting regular polls on a particular issue or topic, pollsters can track how people's views are changing.
What is the Difference Between a Poll and a Survey?
While the terms "poll" and "survey" are often used interchangeably, there is a subtle difference between the two.
A poll usually contains a short set of questions to gauge public opinion on a specific issue or topic. Polls often focus on a single question or a set of related questions and are usually conducted among a smaller, representative sample of the population. The received results are then extrapolated to a broader population group that the questioned population sample falls into.
A survey, on the other hand, typically asks a more extensive and detailed set of questions to gather information about a wider range of topics or issues, and may include both closed-ended questions (with set response options) and open-ended questions (allowing respondents to provide more detailed answers).
Creating an online Poll with SurveyJS
To create an online poll using SurveyJS, take the following steps:
Create a Poll
Create a poll by adding questions and response options. Keep your questions concise and offer choice options that are clear and easy to understand.Customize a Poll
You may want to customize your poll by adding images, changing colors and element sizes, or adding your company name and logo.Visualize a Poll
Create a poll results chart that updates after a user submits their voting form to view results and analyze feedback in real time.Share a Poll
Once your poll is ready, share it with your target audience via email, social media, or embed it on your company website.
In this article, we'll build a sample demo using SurveyJS Form Library and React. The demo runs a sample one-question poll and visualizes survey responses immediately after a user submits their answers.
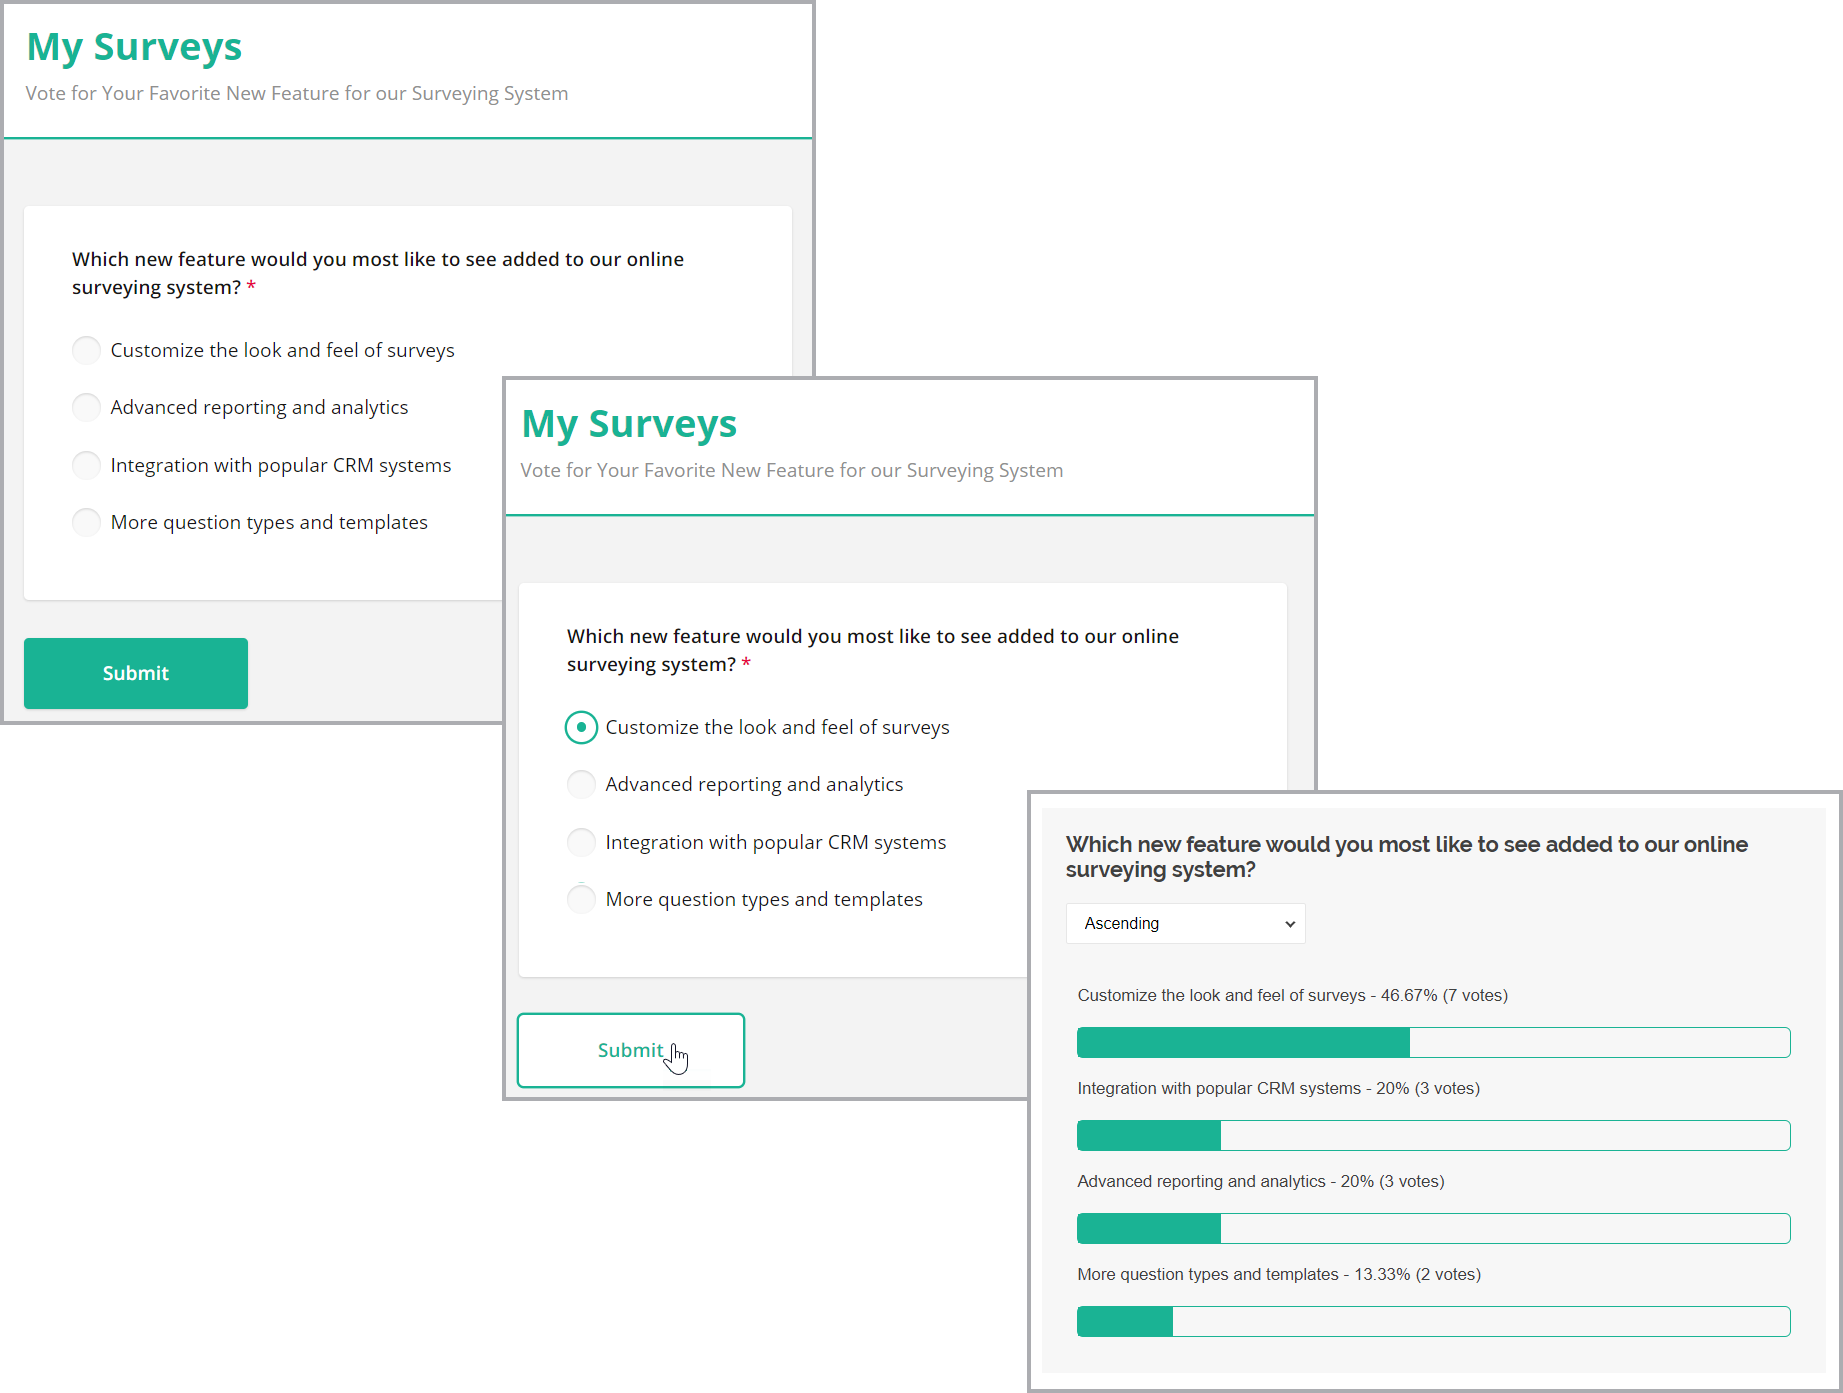
Get started with creating a survey model. We will define a poll that contains the following basic question:
Which feature would you most like us to implement in our online survey system?
- Enhanced customization
- Advanced reporting and analytics
- Integration with popular CRM systems
- More question types and templates
SurveyJS uses the industry-standard JSON format to define a poll or survey as a data model that describes its layout and contents. The following JSON defines a one-page survey with a radio button group question:
{
  completeText: "Submit",
  elements: [
    {
      type: "radiogroup",
      isRequired: true,
      name: "feature",
      title: "Which feature would you most like us to implement in our online surveying system?",
      showOtherItem: false,
      choices: [
        {
          value: "customization",
          text: "Enhanced customization"
        },
        {
          value: "analytics",
          text: "Advanced reporting and analytics"
        },
        {
          value: "crmIntegration",
          text: "Integration with popular CRM systems"
        },
        {
          value: "templates",
          text: "More question types and templates"
        }
      ]
    }
  ]
};
To run a poll, integrate a SurveyJS Form Library into your application. Follow the Get Started guide for your JavaScript platform: SuveyJS Form Library | Get Started.
Once you create a poll model and integrate the poll into your application, it appears as follows:
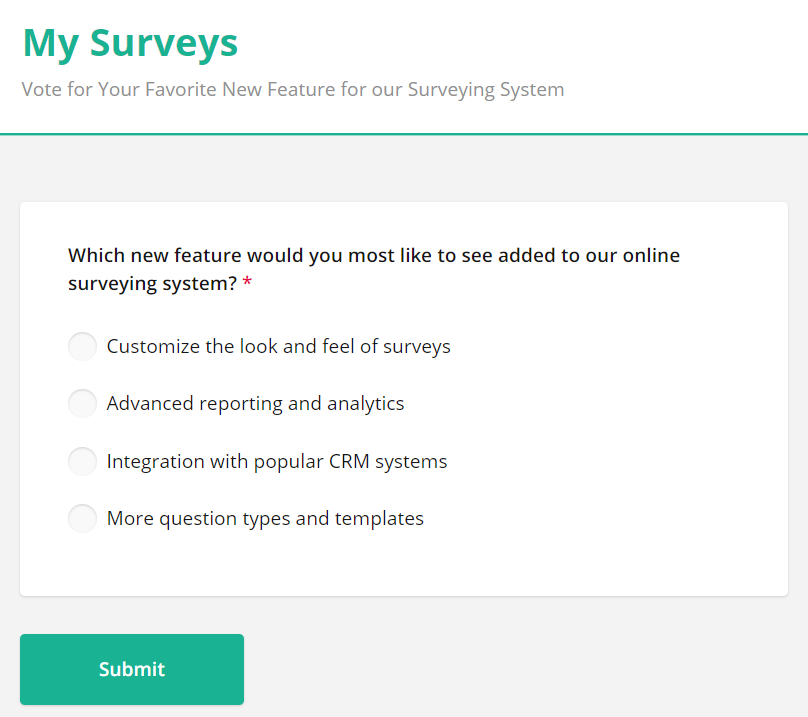
To collect user votes, handle the survey.onComplete event. This event allows you to save a user vote immediately after a user clicks 'Submit' and finishes the poll.
Users select an option and click Submit to finish the poll:
You can access user responses using the survey.data property.
survey.onComplete.add(function (sender, options) {
  // Access a user vote from `sender.data`
  let userVote = sender.data;
  // Save the response to your database
  //...
});
To store user responses, you need to connect your online form with a backend application that connects to a database and saves/loads user responses. SurveyJS provides a guide on how to integrate SurveyJS Libraries with the backend of your choice: Integrate SurveyJS Libraries with Backend. With this integration, you can collect an unlimited number of user responses and retain full ownership of sensitive respondent data.
Instantly Visualize Feedback
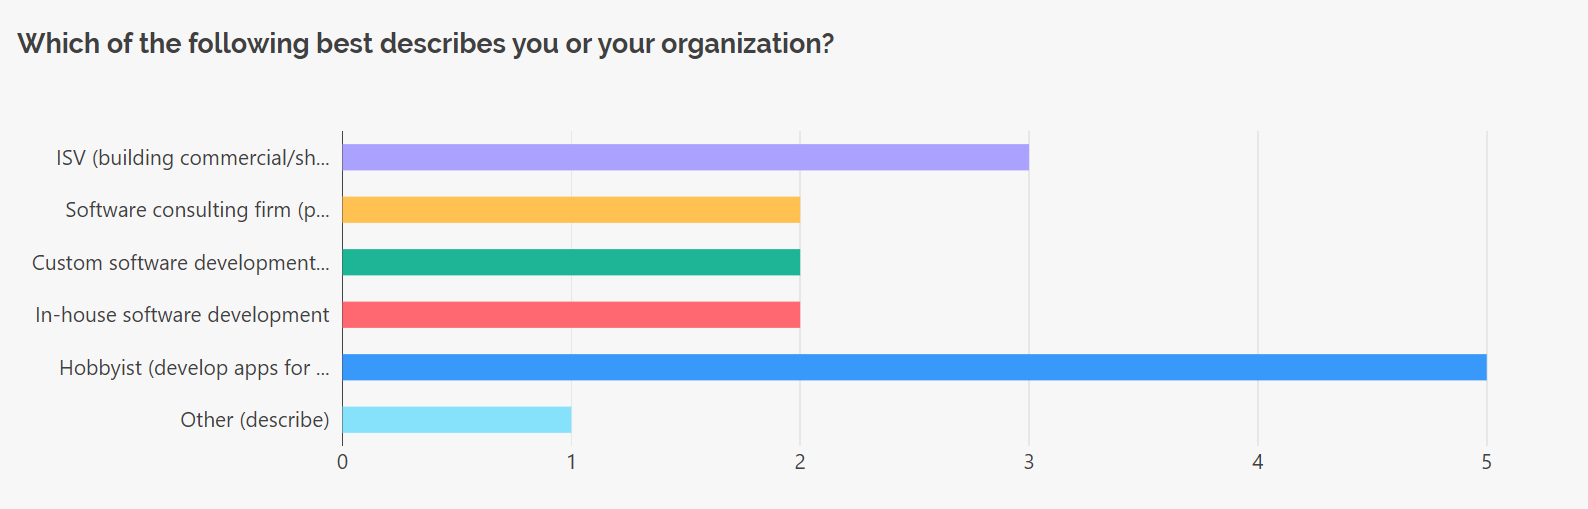
Now that the poll has been created and integrated, you can visualize the results using SurveyJS Dashboard. SurveyJS Dashboard provides different types of visualization options to display poll results, including bar charts, pie/doughnut charts, wordcloud, tables, and more.
SurveyJS Dashboard uses the following default options to visualize Radiogroup answers: bar, pie, or doughnut chart.
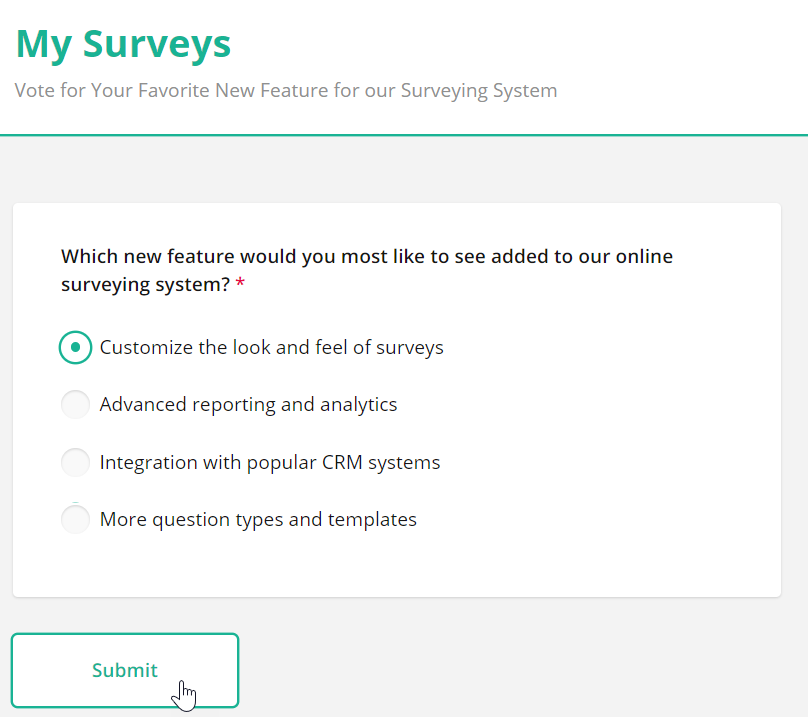
An example of a Bar chart visualizer:
To visualize poll results, you may wish to modify the visualizer and implement a custom Poll visualizer. The following code shows how to create a custom PullVisualizer React component based on a default SelectBase visualizer.
import { DocumentHelper, SelectBase, localization } from "survey-analytics";

function PollVisualizer(question, data, options) {
  var renderContent = function (contentContainer, visualizer) {
    ...
  }
  var visualizer = new SelectBase(
    question,
    data,
    {
      renderContent: renderContent,
      dataProvider: options.dataProvider
    },
    "pollVisualizer"
  );
  visualizer.answersOrder = "asc";
  visualizer.showPercentages = true;
  return visualizer;
}
View Full Code
import { DocumentHelper, SelectBase, localization } from "survey-analytics";

function PollVisualizer(question, data, options) {
  const renderContent = function (contentContainer, visualizer) {
  const answersData = visualizer.getAnswersData();
  const datasets = answersData.datasets;
  const labels = answersData.labels;
  const colors = answersData.colors;
  const texts = answersData.texts;
  const seriesLabels = answersData.seriesLabels;
  const hasSeries = seriesLabels.length > 1;

  const emptyTextNode = DocumentHelper.createElement("p", "", {
    innerHTML: localization.getString("noResults")
  });

  if (datasets.length === 0 || datasets[0].length === 0) {
    contentContainer.appendChild(emptyTextNode);
  return;
  }

  datasets.forEach(function (data, idx) {
    const tableNode = DocumentHelper.createElement("table", "sa-poll-table");

    tableNode.style.backgroundColor = visualizer.backgroundColor;

    data.forEach(function (rowData, index) {
      let row = DocumentHelper.createElement("tr");
      const labelCell = DocumentHelper.createElement(
        "td",
        "sa-poll-table__cell",
        {
          textContent: labels[index] + " - " + texts[idx][index] + "%" + " (" + rowData + " votes)"
        });
      row.appendChild(labelCell);
      tableNode.appendChild(row);

      row = DocumentHelper.createElement("tr");
      const sparklineCell = DocumentHelper.createElement( "td", "sa-poll-table__cell");
      sparklineCell.colspan = "3";
      const outerBar = DocumentHelper.createElement("div", "sa-poll-sparkline");
      const innerBar = DocumentHelper.createElement("div", "sa-poll-sparkline-value");
      innerBar.style.width = texts[idx][index] + "%";
      outerBar.appendChild(innerBar);
      sparklineCell.appendChild(outerBar);
      row.appendChild(sparklineCell);
      tableNode.appendChild(row);
    });
    contentContainer.appendChild(tableNode);
    });
  };
  var visualizer = new SelectBase(
    question,
    data,
    {
      renderContent: renderContent,
      dataProvider: options.dataProvider
    },
    "pollVisualizer"
  );
  visualizer.answersOrder = "asc";
  visualizer.showPercentages = true;
  return visualizer;
}
Please refer to the following demo to learn how to implement a custom Poll visualizer for your JavaScript platform: Bar Chart for Poll Data.
Now, we want to use the custom PollVisualizer to analyze answers users submitted for the select-base questions. For this, unregister the default visualizer and register the custom PollVisualizer:
import { VisualizationManager, SelectBase } from "survey-analytics";

// Unregister the default Radiogroup visualizer
VisualizationManager.unregisterVisualizer("radiogroup", SelectBase);

// Register a custom visualizer for a specified question type
VisualizationManager.registerVisualizer("radiogroup", PollVisualizer);
To visualize poll responses, instantiate VisualizationPanel and pass user responses.
import { VisualizationPanel } from "survey-analytics";

let dataFromServer = // Fetch user responses from a database

const visPanel = new VisualizationPanel(
  this.survey.getAllQuestions(),
  dataFromServer,
  {
    labelTruncateLength: 27,
    allowDynamicLayout: false,
    allowHideQuestions: false
    }
);
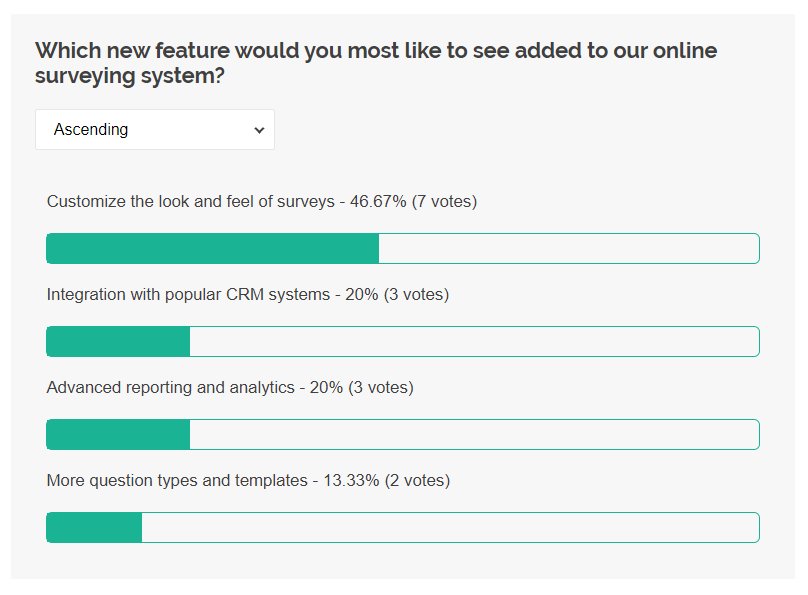
User votes appear as follows:
Demo
Click the Edit in Code Sandbox button below to run a full-scale Code Sandbox demo:

Summary
SurveyJS allows you to easily build a polling system that collects the data you need from a target sample of the population and then visualizes this data with interactive and use-friendly charts. Beside offering a wide variety of popular charts out of the box, SurveyJS also allows you to create a custom visualization component that meets your needs. Finally, with SurveyJS, you can store sensitive user data in-house without any third-party involved.
Happy polling!