What's New in SurveyJS v3.0
SurveyJS began refining the form-building experience in v2.0, with a strong focus on visual improvements, accessibility, and making every interaction for end users more intuitive.
Today, we're thrilled to announce the release of SurveyJS v3.0 Beta. This major update introduces a shared system of CSS variables for seamless UI customization across all SurveyJS components, a complete overhaul of the Dashboard UI and API, more advanced PDF customization capabilities, and a new no-code UI Preset Editor for customizing the Survey Creator interface.
Let's dive in!
Design Tokens — CSS-Based UI Customization
This release introduces a new styling foundation across the entire product family—Form Library, Survey Creator, PDF Generator, and Dashboard. All libraries now share the same set of base CSS variables, creating a more consistent visual system and making it easier to apply common themes across products.
Inspired by Tailwind's utility-first design tokens and scalable variable approach, this new foundation lays the groundwork for a more flexible styling experience in the upcoming major release. As part of the SurveyJS v3.0 rollout, we plan to introduce ready-to-use mapping bridges for popular CSS frameworks, followed by AI-powered tools to help generate custom or hybrid styling configurations in seconds.
Dashboard
In SurveyJS v3.0, the Dashboard library received a major overhaul—both visually and architecturally.
A Modern, Product-Consistent Design
The Dashboard library now feels right at home alongside the rest of the SurveyJS products. We refreshed layouts, spacing, and visual elements to create a cleaner, more contemporary look that's easier to scan and more pleasant to work with—on both desktop and mobile devices.
A New Default Charting Engine
To improve performance and simplify integration, we've implemented support for Chart.js as the new default charting library.
Why the change?
- Smaller bundle size
- Cleaner, UI-focused charts
- Easier styling and better consistency
Plotly.js is still supported for those who need it.
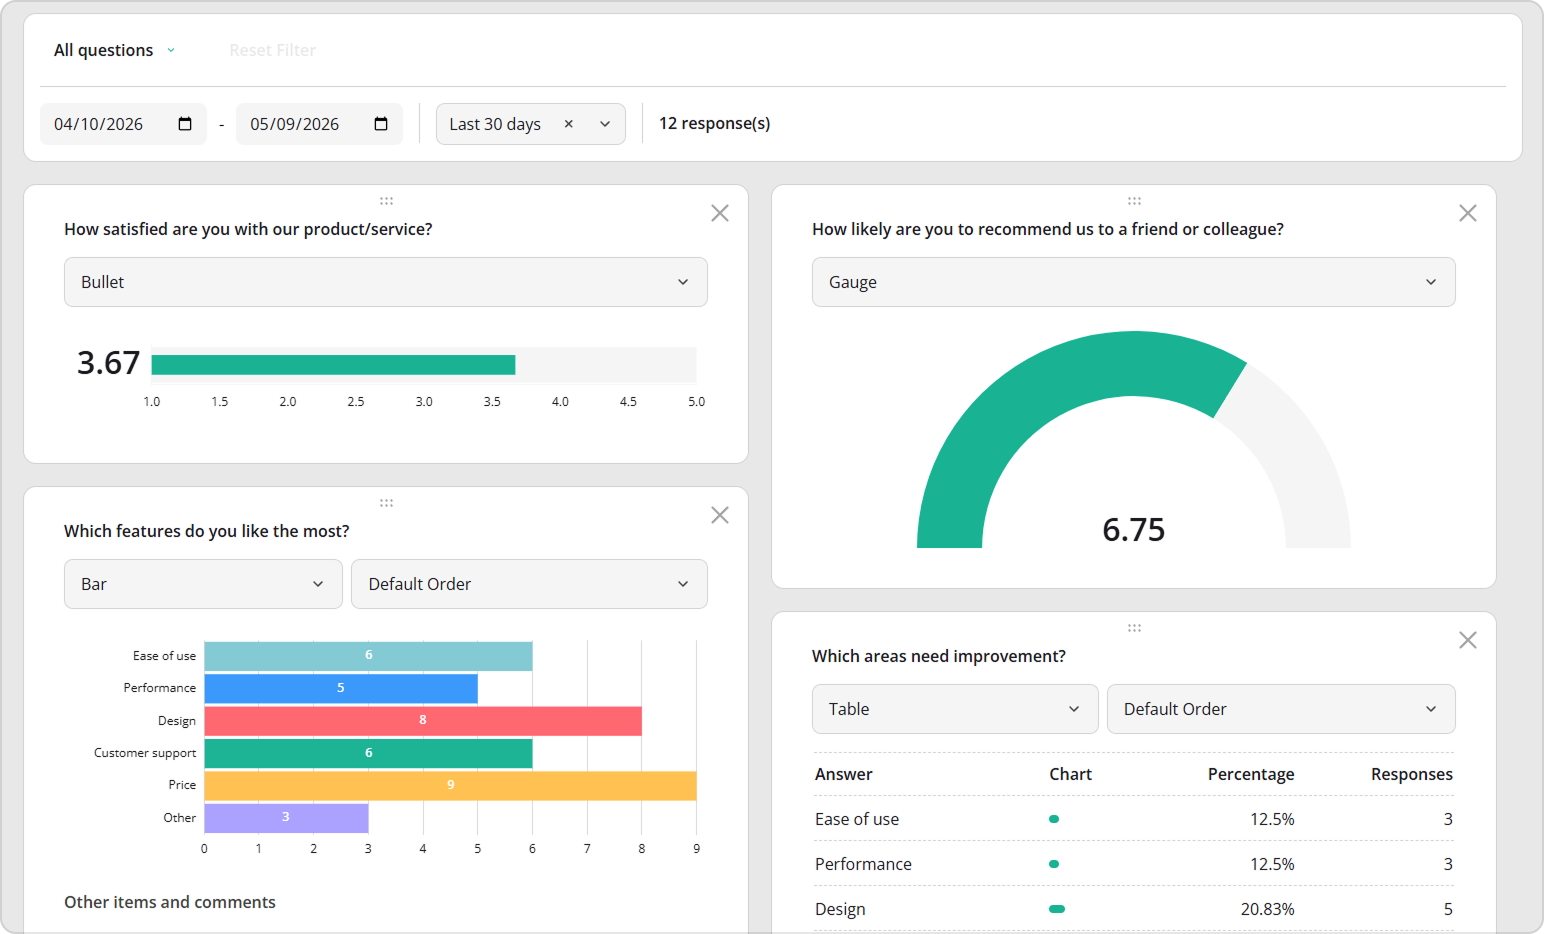
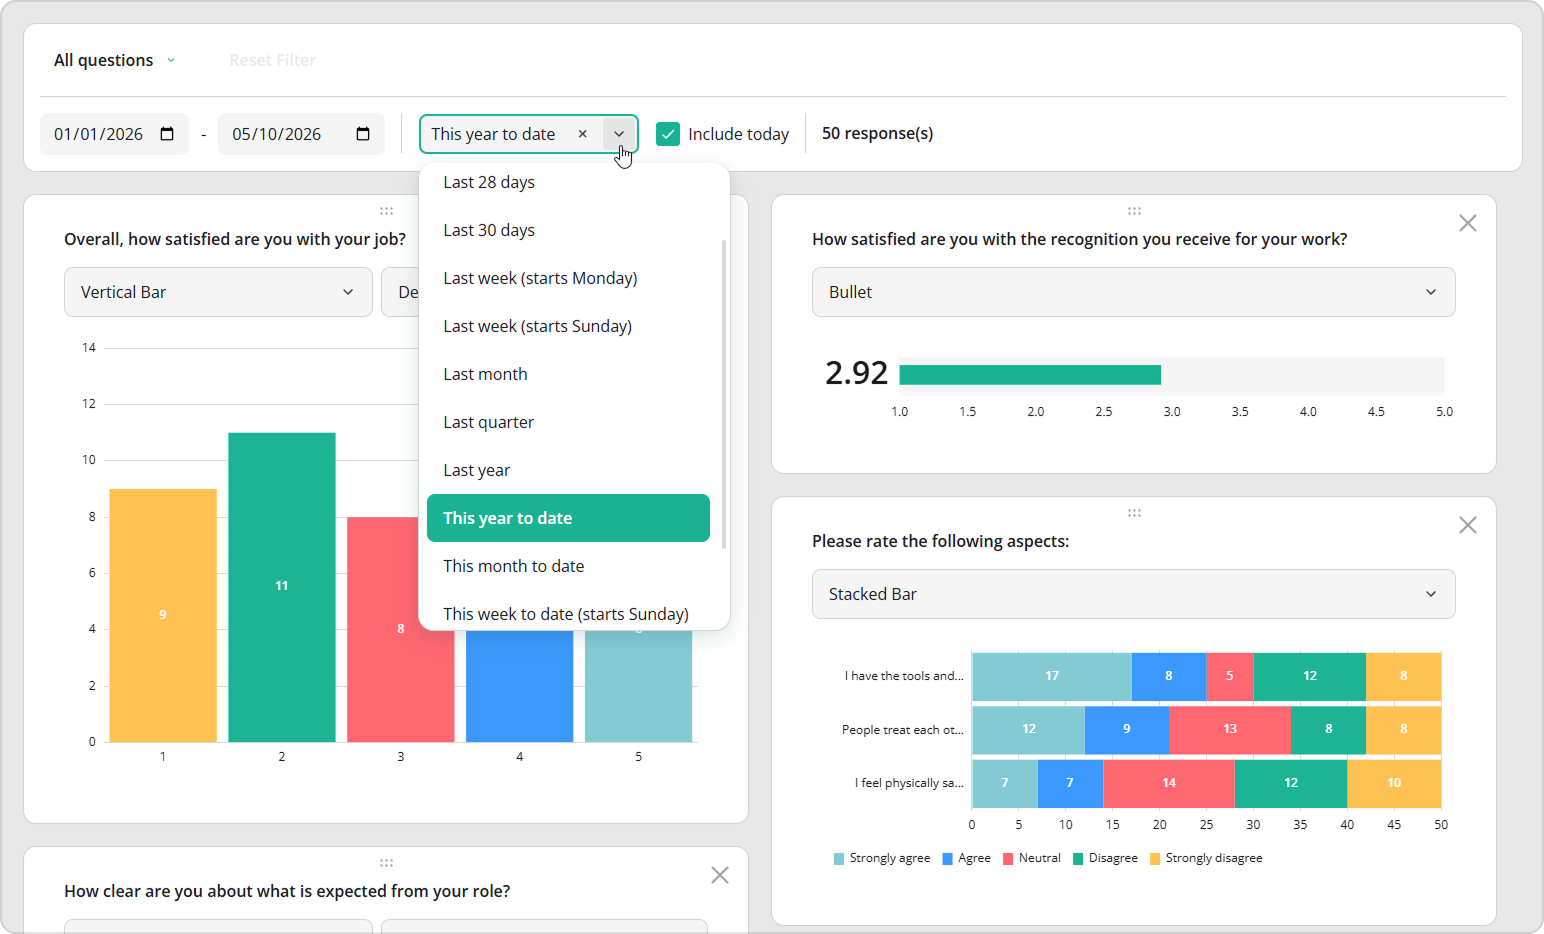
Built-In Date Filtering
Understanding data often starts with choosing the right timeframe. That's why we added intuitive controls that let you filter responses by date:
- Custom start and end dates
- Ready-to-use presets like "Last year", "Last 7 days", "This month to date", "Last quarter"
The control panel also shows how many responses match the filter, so you always know what you're looking at.
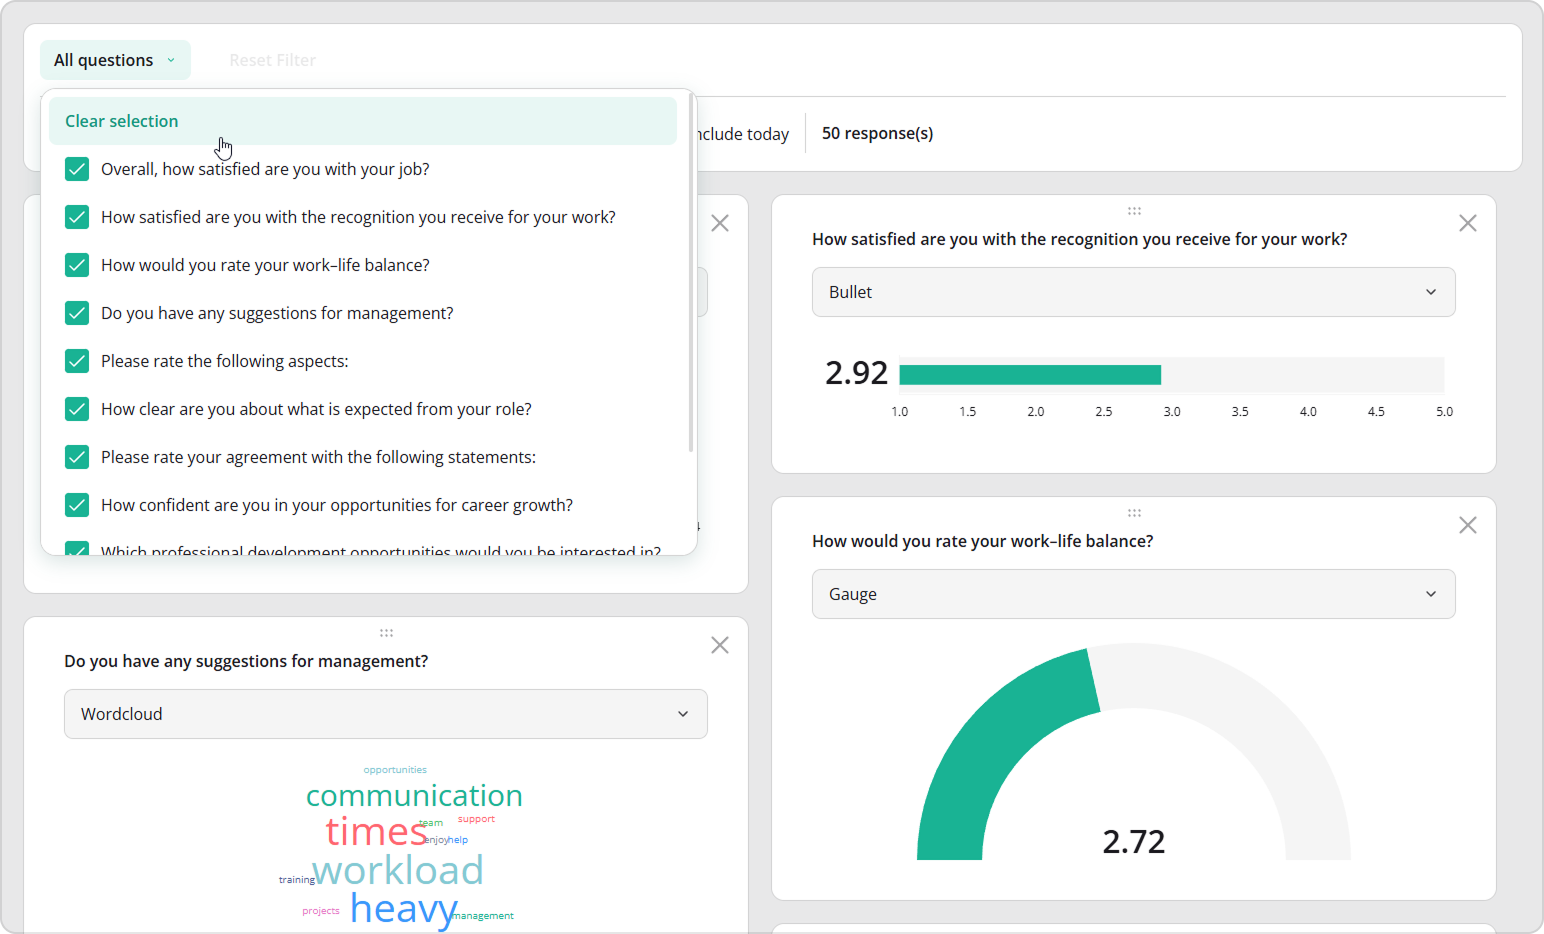
More Control Over What You Visualize
We added flexibility to move legends above or below charts for better layout and readability.
You can also explicitly choose which questions should be visualized in the Dashboard, making it easier to focus on what matters most.
Dynamic Cross-Filtering
Dashboard widgets are now fully interactive. Selecting a value in one chart automatically updates all related charts and tables in the dashboard, so they display only responses from users who selected that value.
You can then drill down further by applying an additional filter in another chart. Each selection narrows the dataset, allowing you to analyze answers from respondents who meet multiple criteria at once. This makes it easy to explore relationships between questions and uncover deeper insights.
Declarative Dashboard Configuration
Explicitly list which questions appear in the Dashboard and adjust the default and available chart types, legend placement, and other visualization settings for better layouts and readability.
State-Based Setup
This is one of the most important architectural changes that v3.0 brings to the Dashbord library.
Instead of configuring every chart, table, and filter through imperative code and multiple API calls, the Dashboard can now be fully defined by a single state object. You pass the state, and the UI simply reflects it.
How it works in practice:
- Render the Dashboard with default settings
- Visually adjust charts, filters, layouts, and options
- Save the resulting state
- Reuse that state whenever you render the Dashboard again
The state captures the entire visual configuration automatically—no need to recreate it step by step in code juggling multiple API calls and configuration steps. You get a simpler, more reliable setup with less code and less logic to maintain, dashboards that are easy to save, copy, and reuse.
Improved Accessibility for Data Visualizations
Accessibility remains a top priority. In SurveyJS v3.0, we enhanced chart accessibility by generating unique identifiers for chart titles, properly grouping visual elements for assistive technologies, and explicitly linking charts to their titles for clearer context. These improvements make dashboards more usable with screen readers and better aligned with modern accessibility standards.
PDF Generator
PDF workflows are critical for many teams—especially when documents must remain pixel-perfect and brand-compliant. In SurveyJS v3.0, we invested heavily in making PDF output more flexible and more visually consistent with SurveyJS web form.
Web and PDF are Now Visually Aligned
PDF forms now look much closer to their web counterparts. Colors, fonts, spacing, and overall layout have been refined, so users experience a consistent design whether they're filling out a form online or reviewing it as a PDF.
CSS-Based Styling
PDF styling is now powered by CSS variables—the same foundation used across SurveyJS—making it easier to apply consistent branding across web and PDF outputs.
Key improvements:
- Colors, typography, spacing, and borders are no longer hard-coded.
- PDF appearance is derived from the active theme.
- Styling becomes more consistent and scalable.
CSS variables are organized into two groups:
Theme variables
Define colors, shadows, and elevation effects. These values can be inherited from the active web theme to preserve visual consistency in PDFs.Layout variables
Control spacing, typography, borders, and corner radius. These are PDF-specific and defined through layout configuration objects or presets.
This separation gives you more flexibility and acknowledges that web and paper forms often require different layout approaches. You can now control visual themes and document layout independently, so web forms and printed/PDF outputs can be tuned separately while still remaining visually aligned.
New Built-In Layout Presets
With the introduction of layout configuration objects, PDF Generator v3.0 now includes built-in layout presets:
- Compact (default) - Optimized for dense forms and reduced page count
- Spacious - Optimized for readability and presentation clarity
Fine-Grained Customization with Styles Config
In addition to themes, we've introduced a new styles configuration system. It allows you to dynamically customize individual elements of the PDF document, including survey and page titles, question containers and spacing, input fields, labels, panels, matrices, and more.
You can adjust colors, font size, font style, and line height, as well as padding, borders, and layout spacing—all without relying on rendering hacks or events.
Better Handling of Complex Layouts
We've also improved how complex question types are rendered in PDF. Matrices, composite question types, and advanced layouts now translate more cleanly into PDFs, making it easier to work with dense data structures and maintain readability in exported forms.
View PDF Generator v3.0 Beta Demo
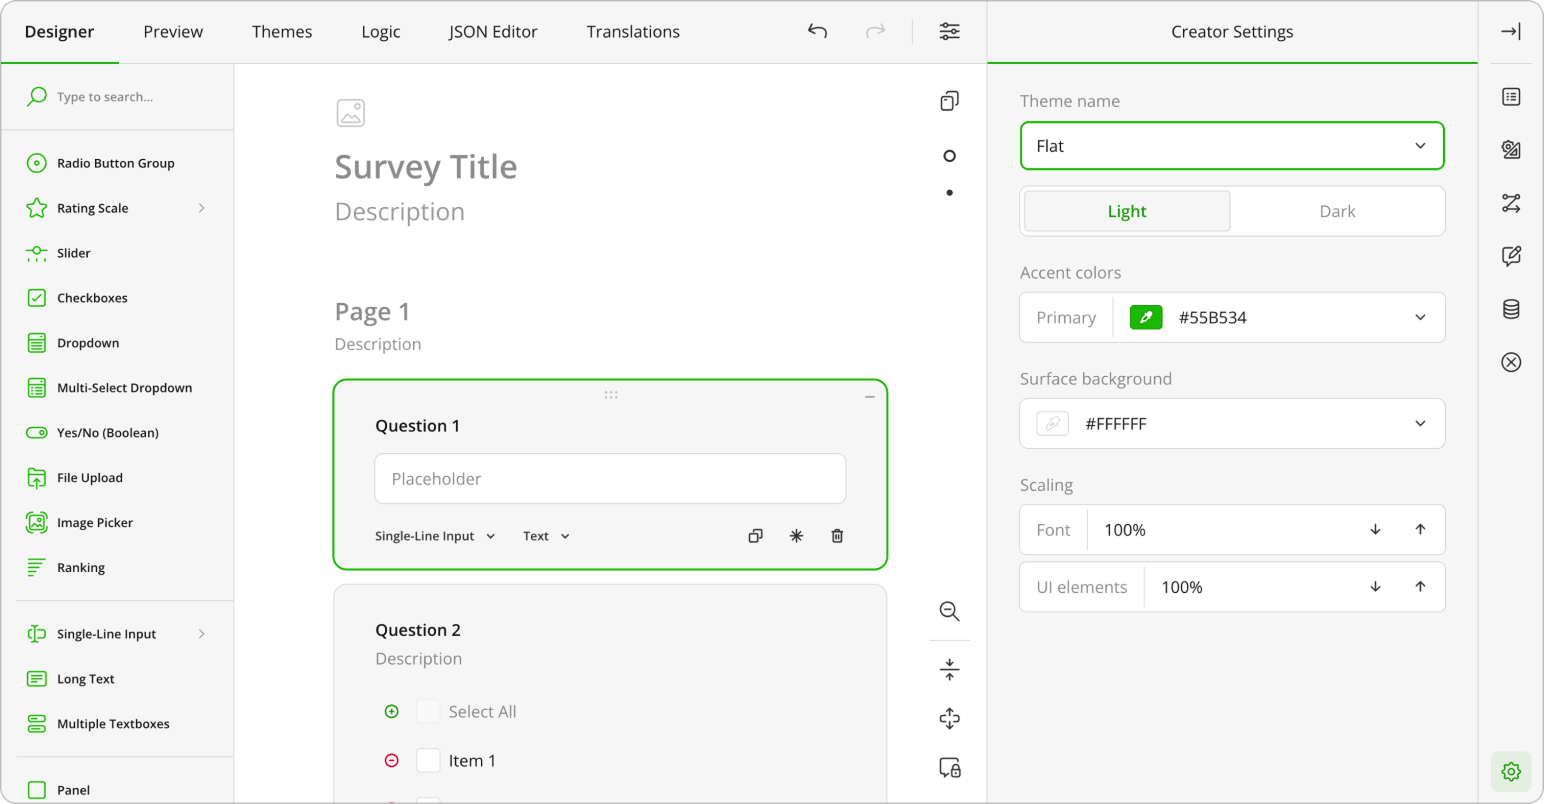
Survey Creator, Your Way
Survey Creator v2.0 focused on visuals. In v3.0, we focused on control.
We introduced a UI Preset Editor that lets you configure Survey Creator's UI and behavior through a dedicated, no-code control panel.
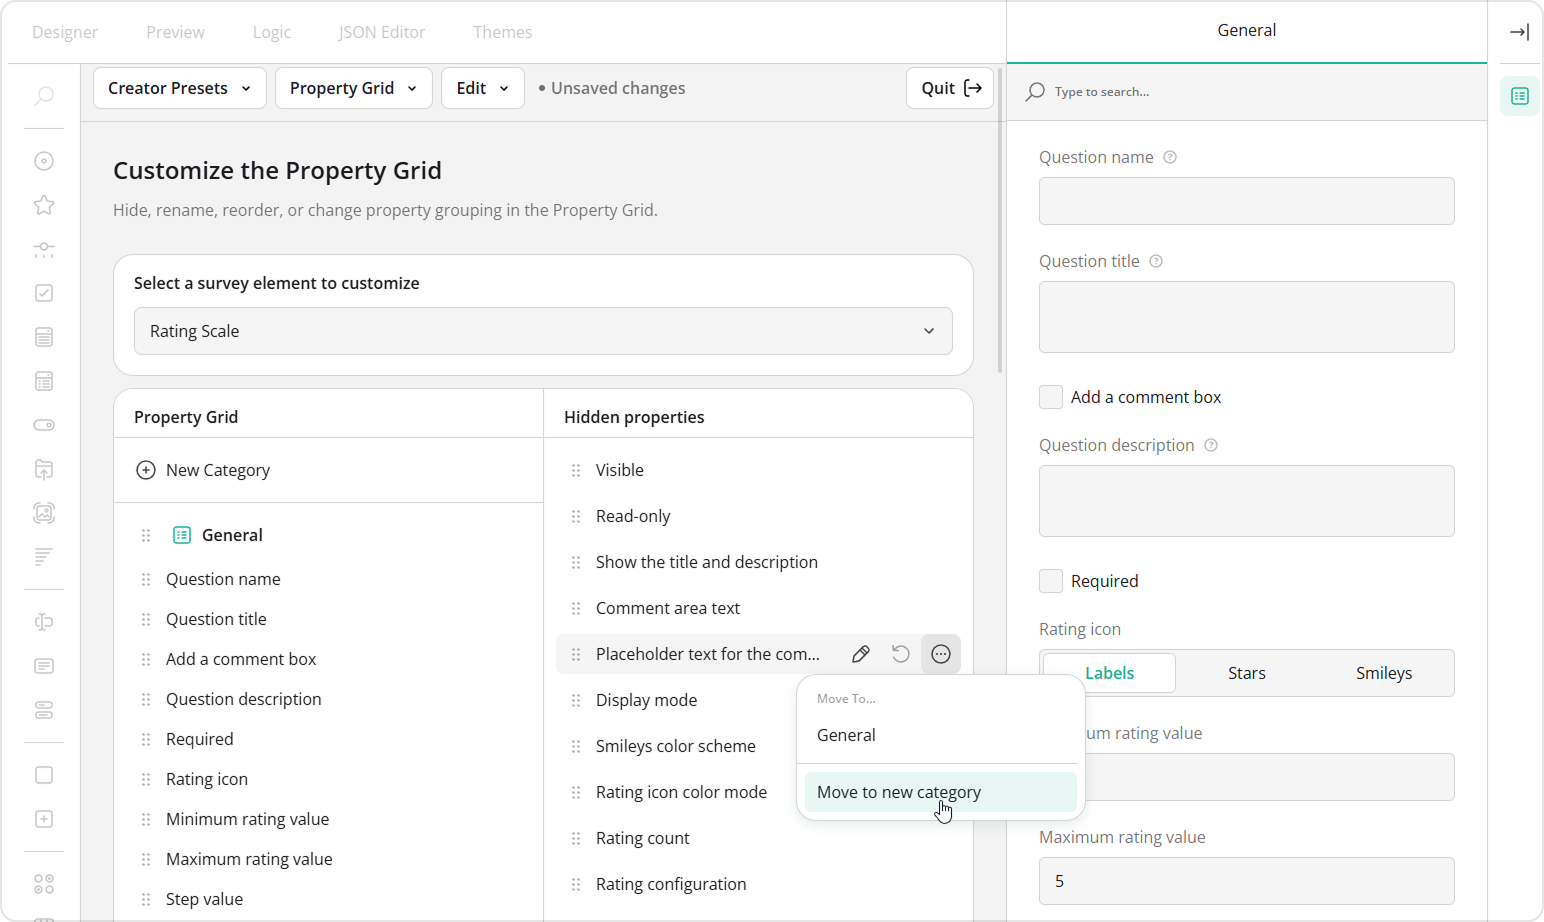
With the UI Preset Editor, you can adjust all major aspects of Survey Creator: customize the Toolbox, manage functional tabs, configure the Property Grid, control language availability, and fine-tune editor behavior for day-to-day usage. Changes are applied instantly, allowing you to preview the result in real time.
Once everything feels right, you can export the configuration as a reusable JSON preset and apply it to Survey Creator with just a few lines of code.
View UI Preset Editor Beta Demo
Ready to Give It a Try?
The Beta release is now available on NPM, and we'd love you to try it and share feedback while we continue refining the release.
More Important Improvements Released Along the Way
While working on SurveyJS v3.0, we continued shipping new features and improvements across the entire product family. Since the release of v2.0 in early 2025, we introduced a wide range of capabilities for Dashboard, Form Library, Survey Creator, and PDF Generator—all of which are already available in production releases today.
As we now introduce the SurveyJS v3.0 Beta, we also wanted to look back at some of the most important additions delivered over the past year.
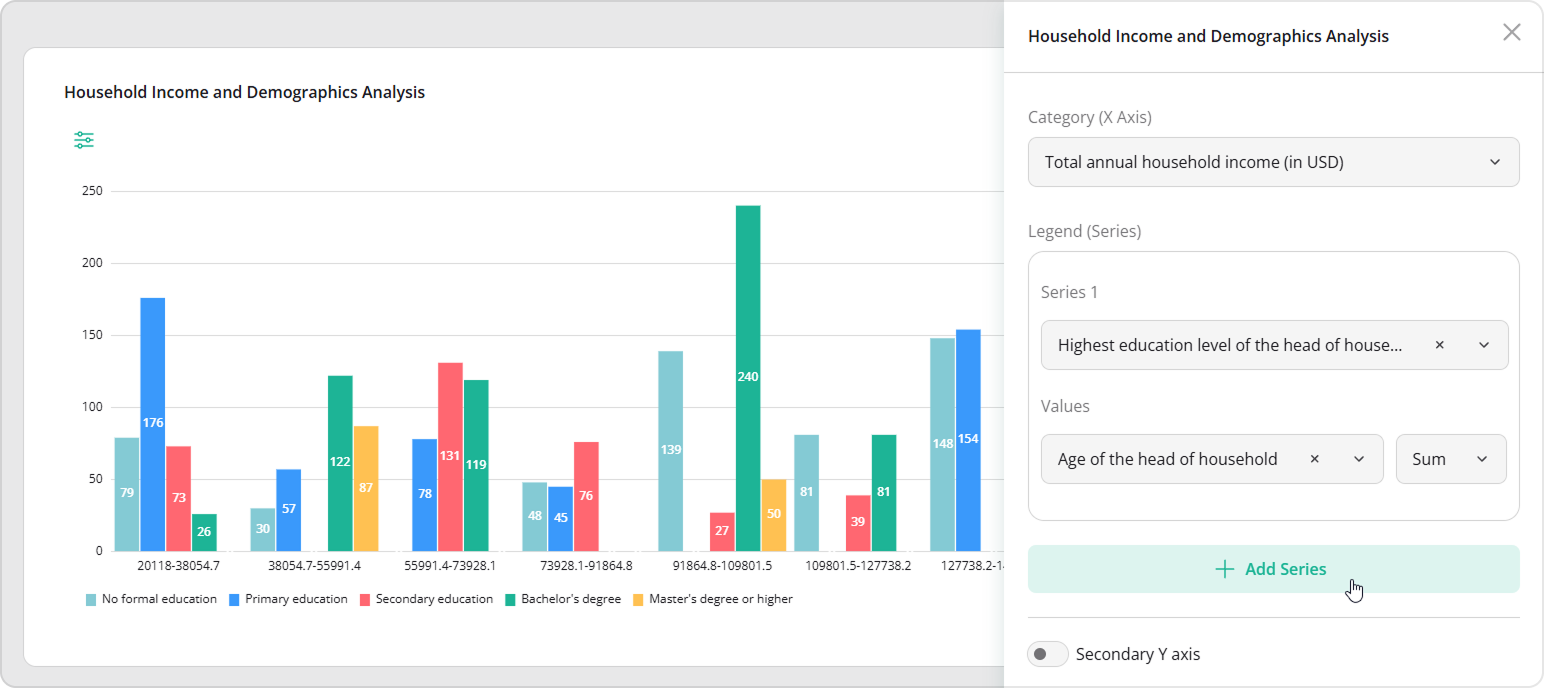
Pivot Chart
You can now visualize survey data in a Pivot Chart, which lets you dynamically group, aggregate, and compare answers across multiple questions. It's especially useful for analyzing large datasets, comparing distributions, and identifying patterns across multiple respondent segments.
By assigning different categories to the X-axis and mapping various values to legends, you can quickly explore relationships between responses—without exporting data or performing manual calculations. The Pivot Chart is ideal when you need a more detailed, analytical view of multiple survey questions.
Support for Specialized and Composite Question Types in Dashboard
Dashboard visualizations now handle specialized and composite questions. For instance, you can create a composite question that combines rating, dropdown, radio, and comment elements into a single survey component. The Dashboard automatically renders each sub-question, letting you visualize complex feedback holistically.
Catching up with Dashboard, Table View now also supports specialized and composite questions.
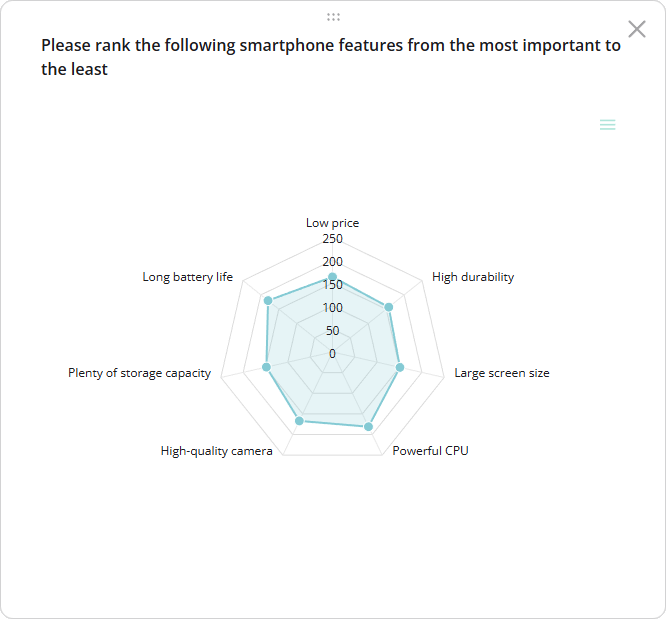
New Radar Chart
Radar charts—also known as spider or web charts—are now automatically supported for Ranking questions. They provide a two-dimensional view of multivariate data, with multiple axes radiating from a central point, where each axis represents a different variable and values are connected to form a polygon. Dashboard users can select Radar from the chart type dropdown to visualize data in this format.
Statistics Table for Boolean Questions
Starting with Dashboard v2.3.5, Yes/No (Boolean) questions can be visualized in a statistics table. This feature is enabled by default and makes reviewing binary responses simpler and clearer.
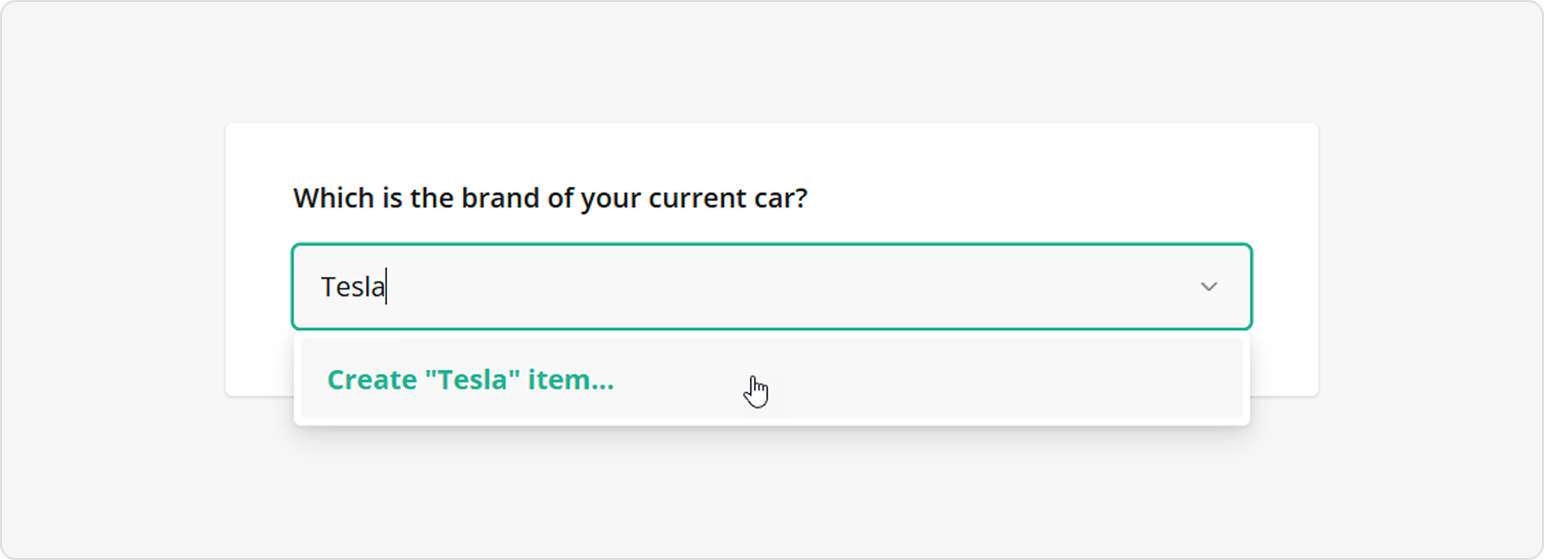
User-Defined Options in Dropdowns and Tag Boxes
Users can now add their own options directly while filling out Dropdown and Tag Box questions. This brings more flexibility to forms without forcing authors to predict every possible answer in advance.
View User-Defined Options Demo
Loop and Merge—More Powerful Than Ever
Loop and Merge makes it easy to collect repeating and structured data—and in 2025, it became even more capable. With Loop and Merge, you can dynamically repeat a group of questions based on user selections, guiding respondents through one item at a time for a more focused experience. Loops can end naturally when users choose to stop, or automatically when specific conditions are met, such as reaching a maximum number of entries or triggering a validation rule.
The feature also supports nested loops, making it possible to model real-world hierarchies like departments and employees, projects and tasks, or any scenario where related data needs to be grouped and merged into a single, structured result. This makes Loop and Merge a powerful tool for collecting complex data without overwhelming respondents.
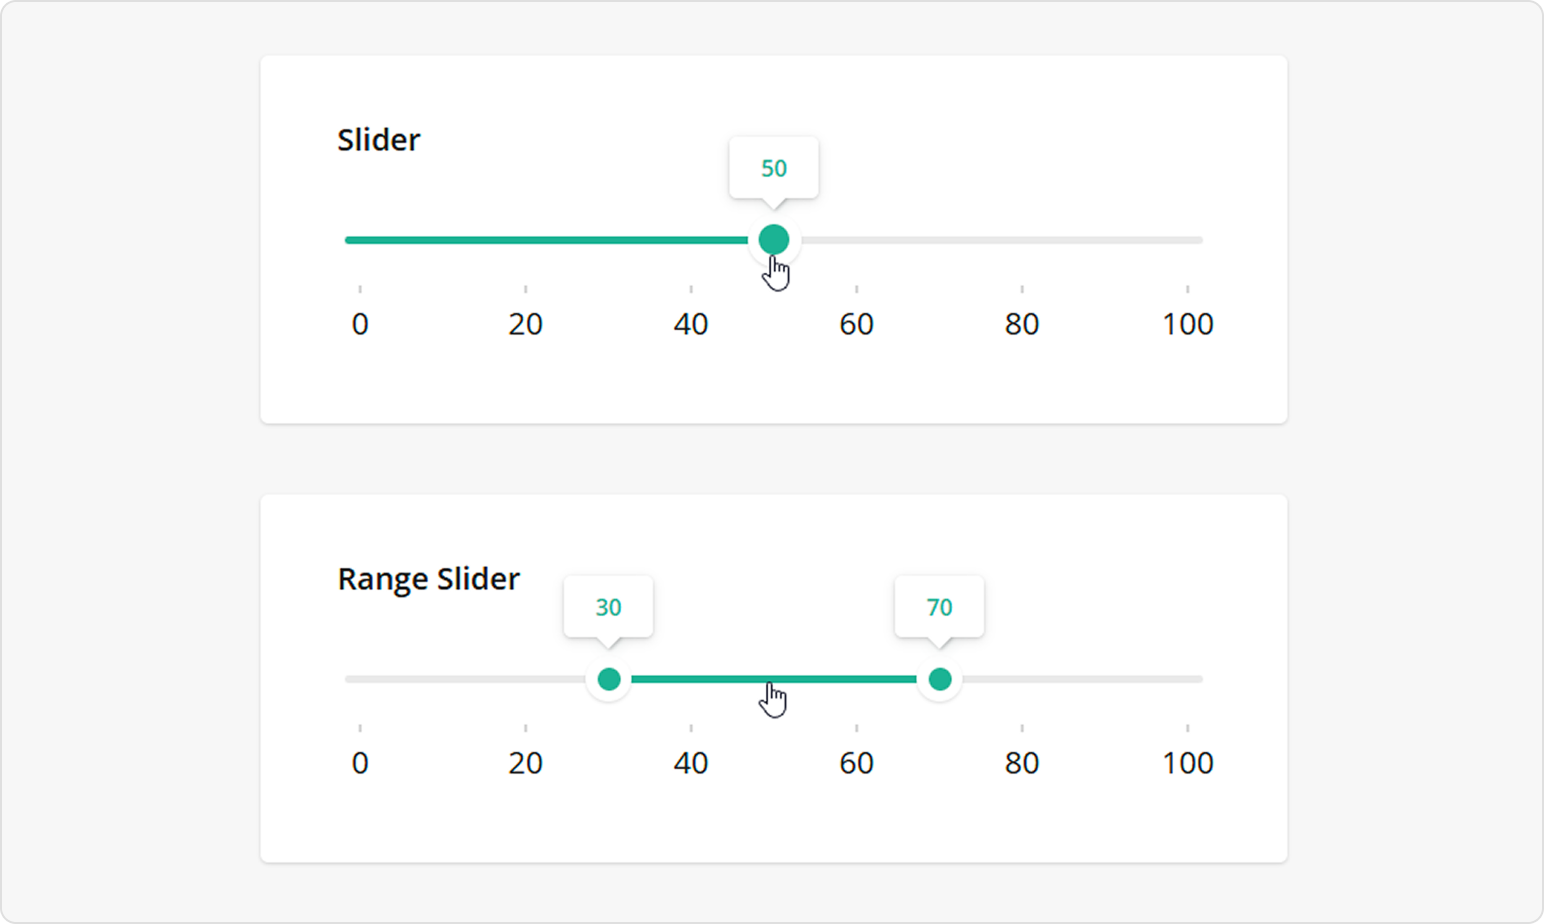
New Slider Question Type
We introduced a new Slider question type that makes numeric input more intuitive and interactive. Sliders can be used as a single-value control when respondents need to select one value from a range, or as a range selector when defining limits such as budgets, thresholds, etc.
The Slider question offers flexible configuration options, including customizable ranges and steps, optional scale labels, and tooltips that display values as users interact with the control. You can also format labels and tooltips, restrict the length of a selected range, move the entire range at once, or bind slider values to input fields for precise editing.
Accessibility Milestones Achieved
Accessibility has been a major focus across multiple releases. Form Library and Survey Creator are now fully accessible when using the Contrast theme.
Compliance has been verified using Axe® and aligns with WCAG, Section 508, and ARIA standards. Improvements are ongoing to bring all SurveyJS libraries to the same level.
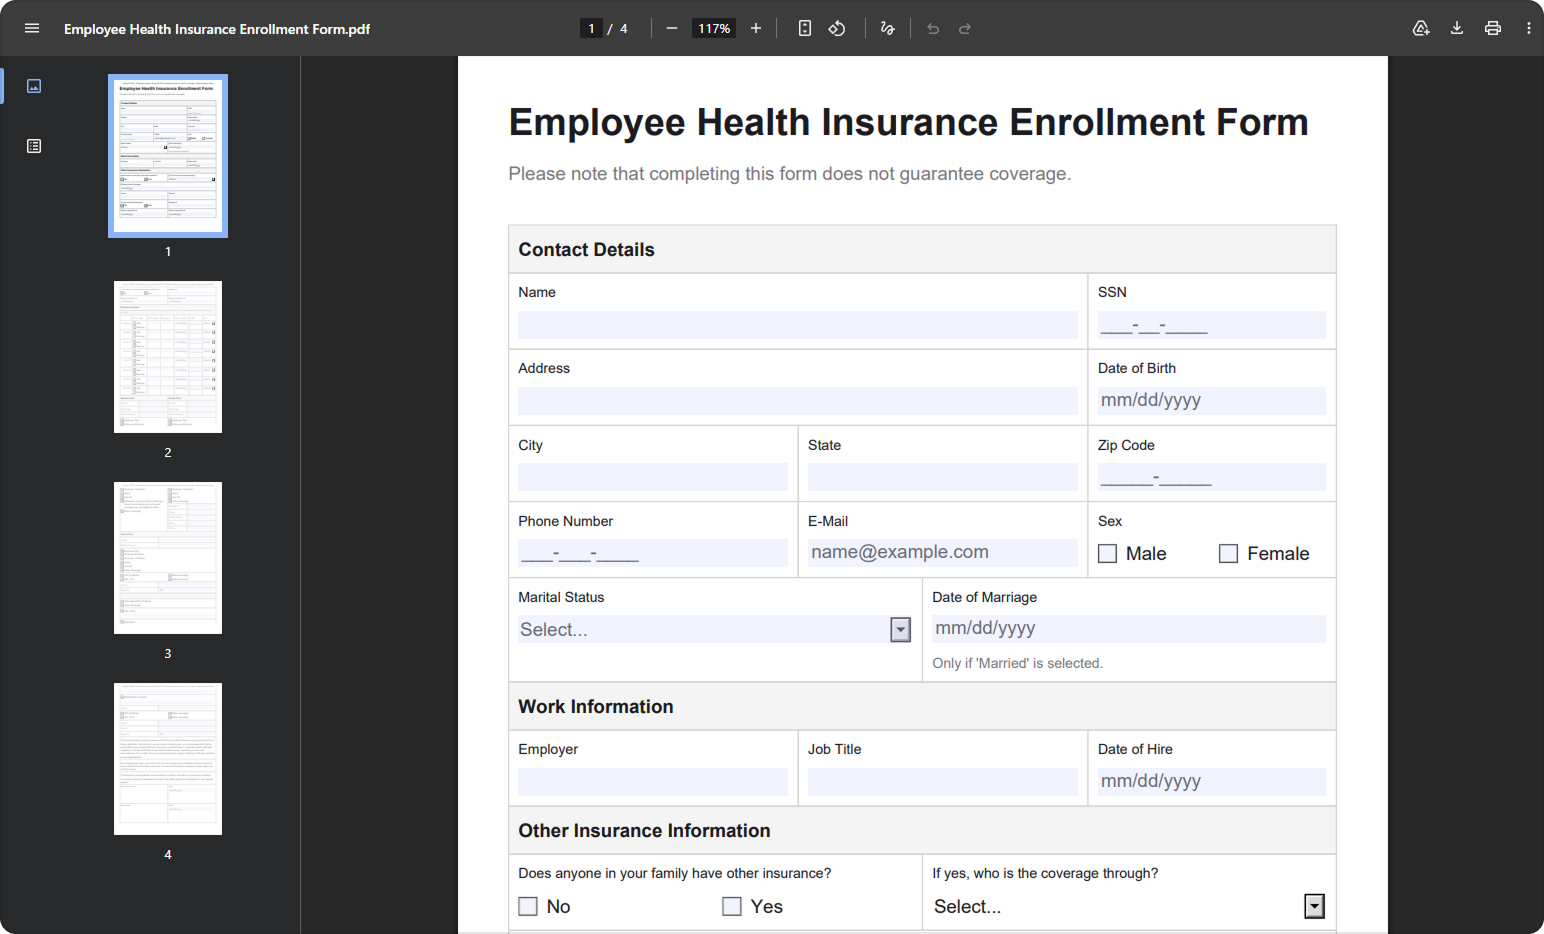
Populate Existing PDF Forms with Survey Data
You can now combine the polished design of your existing PDFs with a modern, interactive form experience. Our new plugin allows you to build a dynamic, user-friendly SurveyJS form and map its fields directly to your existing editable PDF. When users submit the web survey, their responses automatically populate the matching PDF fields—preserving your design perfectly. It's a perfect bridge between traditional PDF documents and modern, intelligent form experiences.
Hybrid Paper and Digital Form Collection
SurveyJS v2.5.23 introduced a new open-source MIT-licensed library: AI Form Response Extractor. This library allows you to process scanned paper forms and convert them into structured SurveyJS JSON data using AI. With this approach, paper forms become an extension of your existing digital workflow instead of a separate manual data entry process.
You can design a form once with SurveyJS, collect responses both online and on paper, and store all submissions in the same unified data format. Responses extracted from scanned documents are normalized into the same SurveyJS JSON structure used for digital submissions, making it easier to integrate paper-based workflows into modern applications and reporting systems.
View Hybrid Paper and Digital Form Collection Guide
What Else?
Checkboxes Enhancements
In addition to the major 2025 improvements, we've added several refinements to make Checkbox and Single-Select Matrix questions more flexible and user-friendly.
Exclusive Options
Any choice can now be marked as exclusive—selecting it automatically clears all other selections. This works perfectly for options like "None", "Refuse to Answer", or "Don't Know", making your surveys more intuitive and reducing accidental selections.
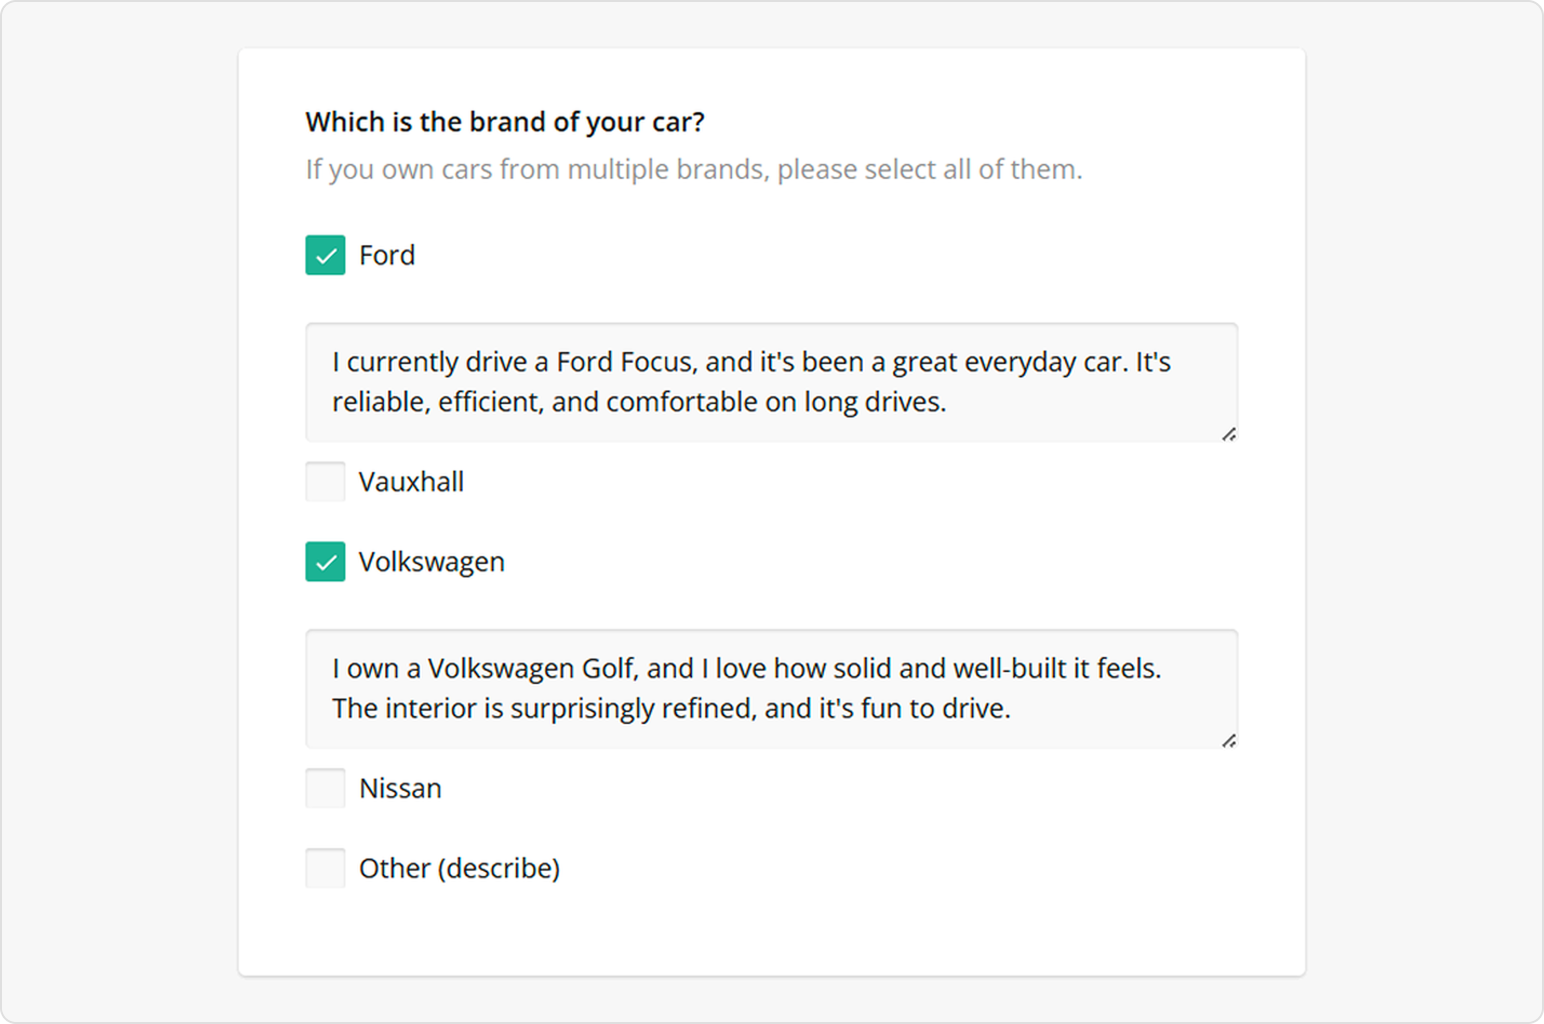
Individual Choice Comments
Respondents can now leave comments for each checkbox option. You can make these comments required and use placeholders to clarify what kind of input is expected, helping users provide detailed feedback while keeping surveys structured.
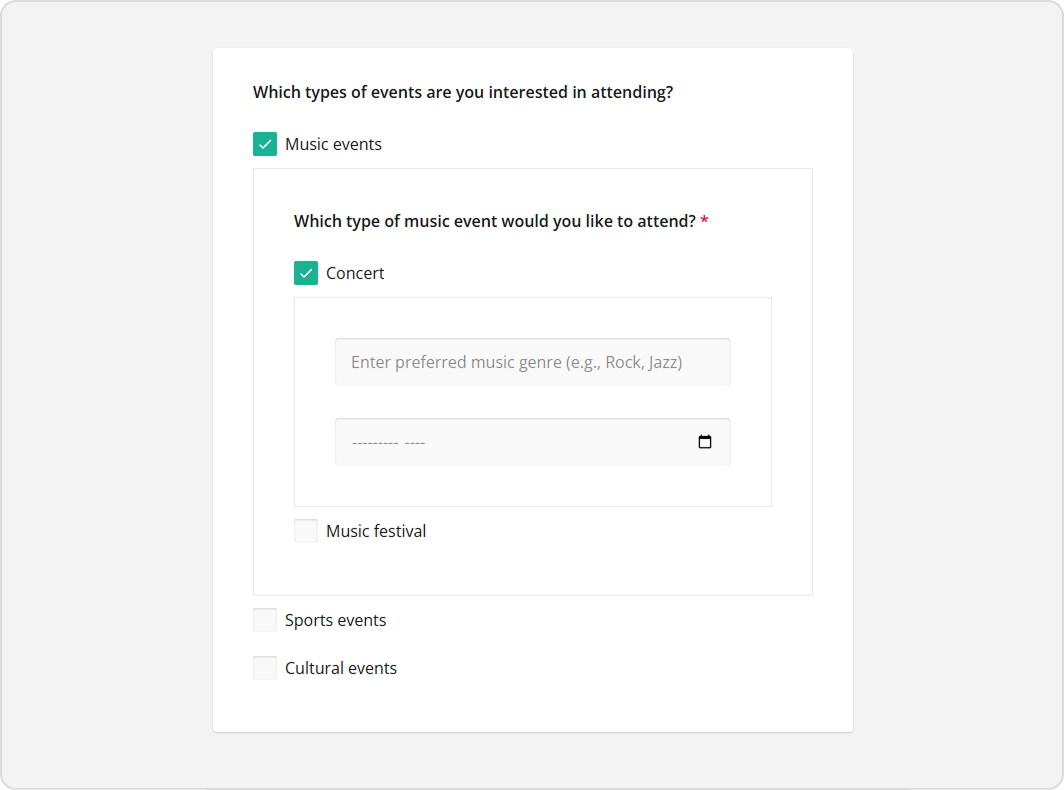
Nested Content Within Choice Options
You can now nest questions and panels directly inside individual choice options in Checkbox and Radio Button Group questions. Instead of building multiple visibility rules and linking separate questions together, you can now place follow-up content exactly where it belongs—inside the selected choice option. When respondents select an option, any associated nested elements appear automatically, keeping surveys clean and relevant.
In SurveyJS v3.0, nested choice content is enabled by default. You can control how many nesting levels are allowed—or disable the feature entirely—using the maxChoiceContentNestingLevel property. If you're using the UI Preset Editor, you can configure this behavior there as well.
View Nested Content Within Choice Options Demo
Matrix with Checkboxes
Matrix questions now support checkboxes in each cell, allowing respondents to select multiple options per row. This is ideal for tracking complex responses, such as device usage or preferences.
View Matrix with Checkboxes Demo
Exclusive Columns in Single-Select Matrix
You can designate a column as exclusive, so selecting it automatically deselects all other options in the row—perfect for "None" or "Not Applicable" choices.
Survey JSON Validation Using Properties Metadata
SurveyJS now bundles a JSON schema with properties metadata. This schema helps validate survey JSON structures, ensuring question and property definitions align with the framework. It can be used in editors, linters, or automated testing workflows to catch configuration issues early.
Starting with v2.3.7, the schema is available in the survey-core npm package and via CDN.
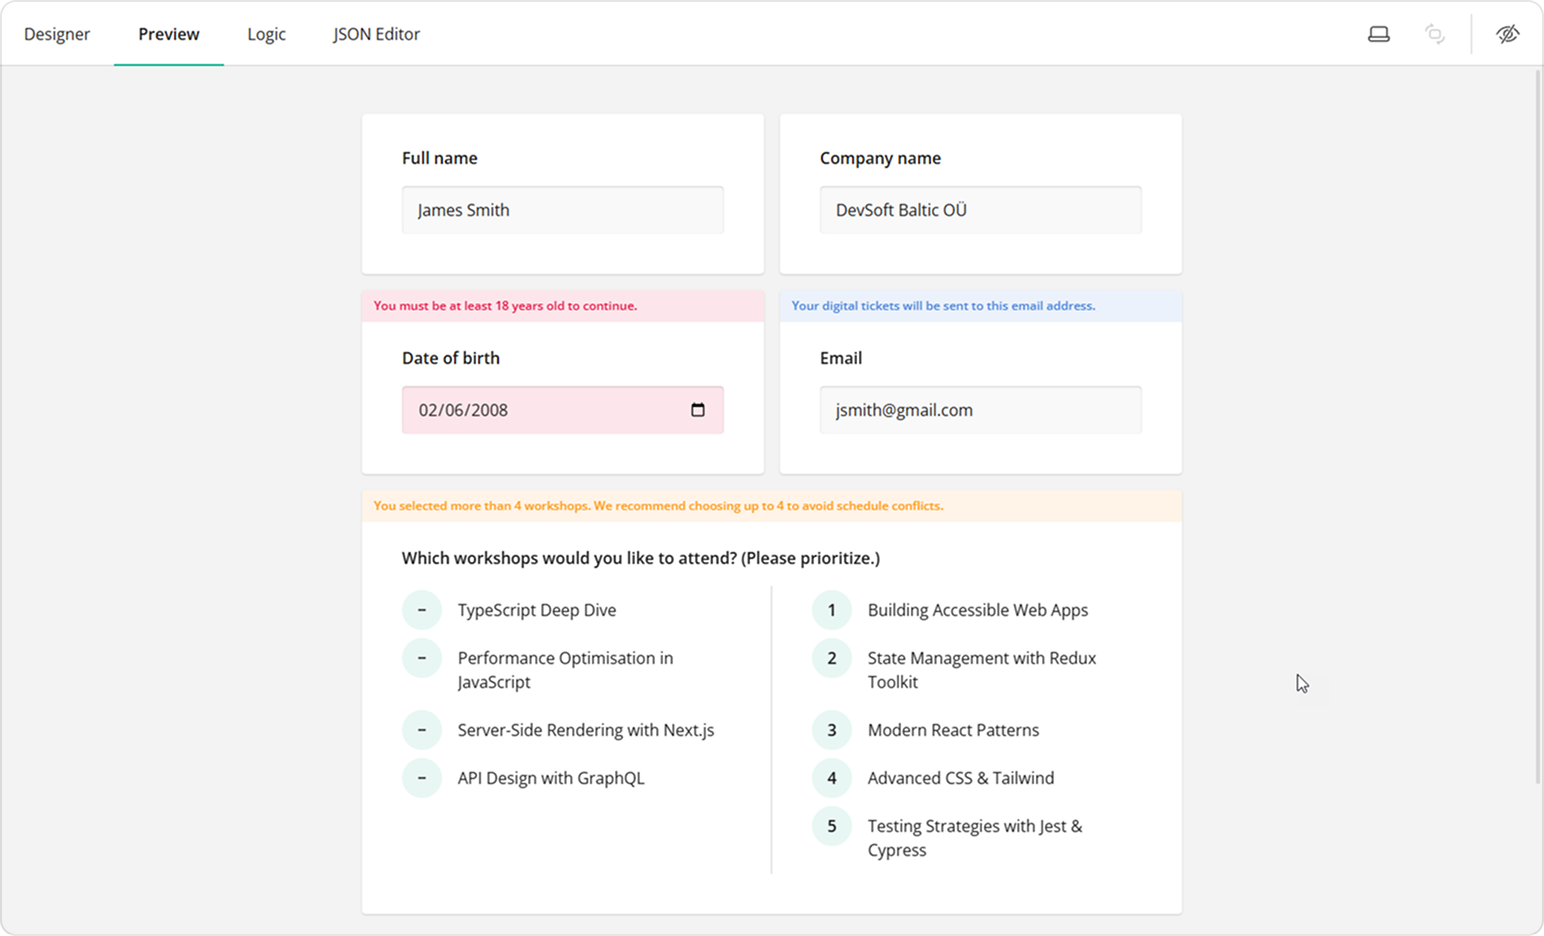
Validation Warnings and Informational Notes
In addition to errors, SurveyJS now supports warnings and informational notes. Warnings flag potential issues, and informational notes provide guidance, but neither blocks respondents from completing the survey.
What's Next?
SurveyJS v3.0 is all about clarity, flexibility, and control—from dashboards you can configure declaratively, to PDFs that reflects your web form, to the UI Preset Editor that adapts Survey Creator to your end users' requirements.
And yes—there's more coming! Check out our Roadmap to see what we're building next.