SurveyJS Dashboard Overview
SurveyJS Dashboard visualizes survey results and allows users to analyze them.
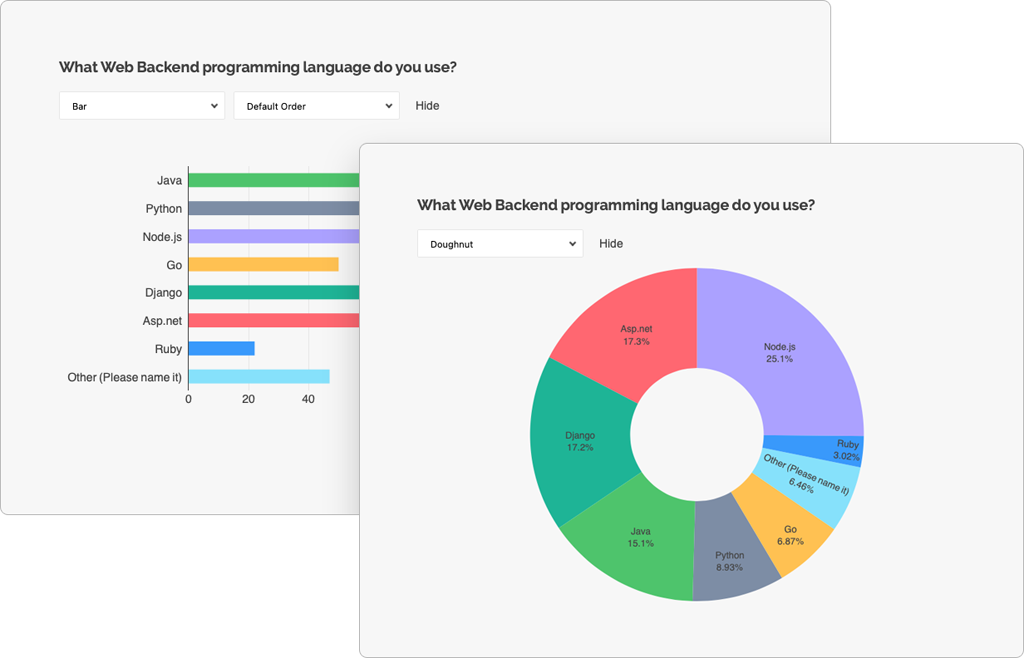
Features
- Supported chart types:
- Interactive filtering
- Customizable colors
- Dynamic layout
- Chart reordering via drag and drop
Get Started
We also include multiple demo examples that allow you to edit and copy code.
What's New
Visit our What's New page for information on new features, recent bug fixes, and latest additions.
Licensing
SurveyJS Dashboard is not available for free commercial usage. If you want to integrate it into your application, you must purchase a commercial license.
Was this article helpful?
Send feedback to the SurveyJS team
Need help? Visit our support page